
Page 481 - Microeconomics, Fourth Edition
P. 481
c11monopolyandmonopsony.qxd 7/14/10 7:58 PM Page 455
11.2 THE IMPORTANCE OF PRICE ELASTICITY OF DEMAND 455
Price (dollars per unit) P B B
I
A
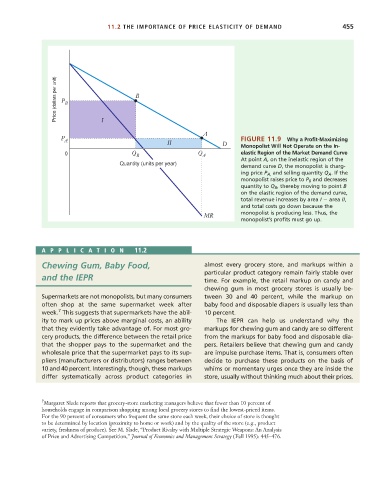
P A II D FIGURE 11.9 Why a Profit-Maximizing
elastic Region of the Market Demand Curve
0 Q B Q A Monopolist Will Not Operate on the In-
At point A, on the inelastic region of the
Quantity (units per year)
demand curve D, the monopolist is charg-
ing price P A, and selling quantity Q A . If the
monopolist raises price to P B and decreases
quantity to Q B , thereby moving to point B
on the elastic region of the demand curve,
total revenue increases by area I area II,
and total costs go down because the
MR monopolist is producing less. Thus, the
monopolist’s profits must go up.
APPLICA TION 11.2
Chewing Gum, Baby Food, almost every grocery store, and markups within a
particular product category remain fairly stable over
and the IEPR time. For example, the retail markup on candy and
chewing gum in most grocery stores is usually be-
Supermarkets are not monopolists, but many consumers tween 30 and 40 percent, while the markup on
often shop at the same supermarket week after baby food and disposable diapers is usually less than
7
week. This suggests that supermarkets have the abil- 10 percent.
ity to mark up prices above marginal costs, an ability The IEPR can help us understand why the
that they evidently take advantage of. For most gro- markups for chewing gum and candy are so different
cery products, the difference between the retail price from the markups for baby food and disposable dia-
that the shopper pays to the supermarket and the pers. Retailers believe that chewing gum and candy
wholesale price that the supermarket pays to its sup- are impulse purchase items. That is, consumers often
pliers (manufacturers or distributors) ranges between decide to purchase these products on the basis of
10 and 40 percent. Interestingly, though, these markups whims or momentary urges once they are inside the
differ systematically across product categories in store, usually without thinking much about their prices.
7 Margaret Slade reports that grocery-store marketing managers believe that fewer than 10 percent of
households engage in comparison shopping among local grocery stores to find the lowest-priced items.
For the 90 percent of consumers who frequent the same store each week, their choice of store is thought
to be determined by location (proximity to home or work) and by the quality of the store (e.g., product
variety, freshness of produce). See M. Slade, “Product Rivalry with Multiple Strategic Weapons: An Analysis
of Price and Advertising Competition,” Journal of Economics and Management Strategy (Fall 1995): 445–476.