
Page 570 - Microeconomics, Fourth Edition
P. 570
c13marketstructureandcompetition.qxd 7/30/10 10:44 AM Page 544
544 CHAPTER 13 MARKET STRUCTURE AND COMPETITION
THE STACKELBERG MODEL OF OLIGOPOLY
In the Cournot model of quantity setting, both firms are assumed to choose their
quantities simultaneously. However, in some situations, it might be more natural to
assume that one firm chooses its quantity before the other firms make their choices.
This assumption may be especially natural if we think of the quantities as levels of pro-
duction capacity. In many oligopolistic industries, capacity expansion decisions tend
to occur sequentially rather than simultaneously. For example, in the U.S. turbine
generator industry of the 1950s and 1960s, Westinghouse and Allis-Chalmers gener-
ally undertook major capacity expansions only after industry leader, General Electric,
had expanded its capacity. 16
Stackelberg model of The Stackelberg model of oligopoly pertains to a situation in which one firm
oligopoly A situation in acts as a quantity leader, choosing its quantity first, with all other firms acting as fol-
which one firm acts as a lowers, making their quantity decisions after the leader has moved. To illustrate the
quantity leader, choosing its Stackelberg model, we will continue to use the example of the DRAM market, but
quantity first, with all other now we will assume that Samsung (Firm 1) acts as the Stackelberg leader and chooses
firms acting as followers.
its output first, and LG (Firm 2) acts as the Stackelberg follower and chooses its out-
put after the leader has made its choice.
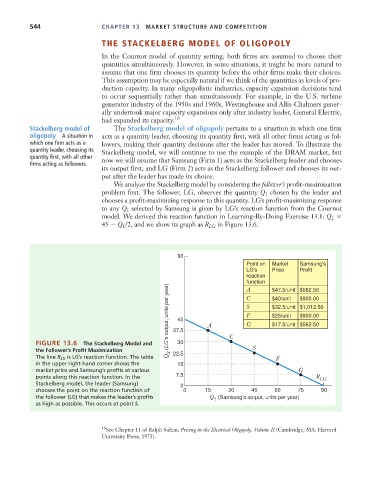
We analyze the Stackelberg model by considering the follower’s profit-maximization
problem first. The follower, LG, observes the quantity Q chosen by the leader and
1
chooses a profit-maximizing response to this quantity. LG’s profit-maximizing response
to any Q selected by Samsung is given by LG’s reaction function from the Cournot
1
model. We derived this reaction function in Learning-By-Doing Exercise 13.1: Q
2
45 Q /2, and we show its graph as R LG in Figure 13.6.
1
90
Point on Market Samsung's
LG's Price Profit
reaction
function $47.5/unit $562.50
Q 2 (LG's output, units per year) 37.5 A S $32.5/unit $1,012.50
A
C
$40/unit
$900.00
F
$900.00
$25/unit
45
G
$17.5/unit $562.50
FIGURE 13.6 The Stackelberg Model and 30 C
the Follower’s Profit Maximization 22.5 S
The line R LG is LG’s reaction function. The table F
in the upper right-hand corner shows the 15
market price and Samsung’s profits at various G
points along this reaction function. In the 7.5 R LG
Stackelberg model, the leader (Samsung) 0
chooses the point on the reaction function of 0 15 30 45 60 75 90
the follower (LG) that makes the leader’s profits Q (Samsung's output, units per year)
1
as high as possible. This occurs at point S.
16 See Chapter 11 of Ralph Sultan, Pricing in the Electrical Oligopoly, Volume II (Cambridge, MA: Harvard
University Press, 1975).