
Page 585 - Microeconomics, Fourth Edition
P. 585
c13marketstructureandcompetition.qxd 7/30/10 10:44 AM Page 559
13.5 MONOPOLISTIC COMPETITION 559
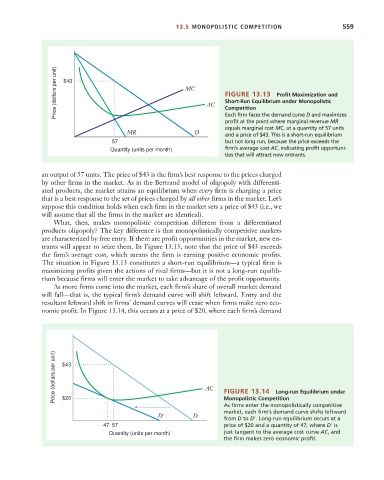
Price (dollars per unit) $43 MC AC FIGURE 13.13 Profit Maximization and
Short-Run Equilibrium under Monopolistic
Competition
Each firm faces the demand curve D and maximizes
profit at the point where marginal revenue MR
equals marginal cost MC, at a quantity of 57 units
MR D and a price of $43. This is a short-run equilibrium
57 but not long run, because the price exceeds the
Quantity (units per month) firm’s average cost AC, indicating profit opportuni-
ties that will attract new entrants.
an output of 57 units. The price of $43 is the firm’s best response to the prices charged
by other firms in the market. As in the Bertrand model of oligopoly with differenti-
ated products, the market attains an equilibrium when every firm is charging a price
that is a best response to the set of prices charged by all other firms in the market. Let’s
suppose this condition holds when each firm in the market sets a price of $43 (i.e., we
will assume that all the firms in the market are identical).
What, then, makes monopolistic competition different from a differentiated
products oligopoly? The key difference is that monopolistically competitive markets
are characterized by free entry. If there are profit opportunities in the market, new en-
trants will appear to seize them. In Figure 13.13, note that the price of $43 exceeds
the firm’s average cost, which means the firm is earning positive economic profits.
The situation in Figure 13.13 constitutes a short-run equilibrium—a typical firm is
maximizing profits given the actions of rival firms—but it is not a long-run equilib-
rium because firms will enter the market to take advantage of the profit opportunity.
As more firms come into the market, each firm’s share of overall market demand
will fall—that is, the typical firm’s demand curve will shift leftward. Entry and the
resultant leftward shift in firms’ demand curves will cease when firms make zero eco-
nomic profit. In Figure 13.14, this occurs at a price of $20, where each firm’s demand
Price (dollars per unit) $43 AC
FIGURE 13.14
Long-run Equilibrium under
Monopolistic Competition
$20
As firms enter the monopolistically competitive
market, each firm’s demand curve shifts leftward
D' D from D to D . Long-run equilibrium occurs at a
47 57 price of $20 and a quantity of 47, where D is
Quantity (units per month) just tangent to the average cost curve AC, and
the firm makes zero economic profit.