
Page 654 - Microeconomics, Fourth Edition
P. 654
c15riskandinformation.qxd 8/16/10 11:10 AM Page 628
628 CHAPTER 15 RISK AND INFORMATION
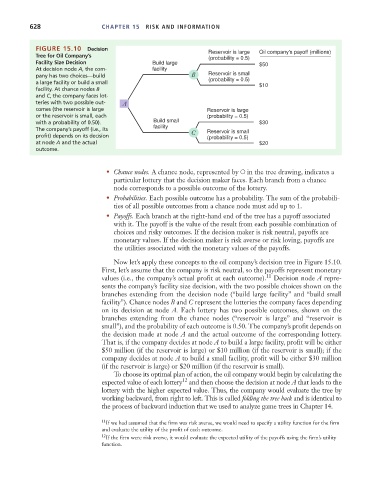
FIGURE 15.10 Decision
Reservoir is large Oil company's payoff (millions)
Tree for Oil Company’s
(probability = 0.5)
Facility Size Decision Build large $50
At decision node A, the com- facility
pany has two choices—build B Reservoir is small
a large facility or build a small (probability = 0.5) $10
facility. At chance nodes B
and C, the company faces lot-
teries with two possible out- A
comes (the reservoir is large Reservoir is large
or the reservoir is small, each (probability = 0.5)
with a probability of 0.50). Build small $30
The company’s payoff (i.e., its facility C Reservoir is small
profit) depends on its decision (probability = 0.5)
at node A and the actual $20
outcome.
• Chance nodes. A chance node, represented by ~ in the tree drawing, indicates a
particular lottery that the decision maker faces. Each branch from a chance
node corresponds to a possible outcome of the lottery.
• Probabilities. Each possible outcome has a probability. The sum of the probabili-
ties of all possible outcomes from a chance node must add up to 1.
• Payoffs. Each branch at the right-hand end of the tree has a payoff associated
with it. The payoff is the value of the result from each possible combination of
choices and risky outcomes. If the decision maker is risk neutral, payoffs are
monetary values. If the decision maker is risk averse or risk loving, payoffs are
the utilities associated with the monetary values of the payoffs.
Now let’s apply these concepts to the oil company’s decision tree in Figure 15.10.
First, let’s assume that the company is risk neutral, so the payoffs represent monetary
values (i.e., the company’s actual profit at each outcome). 11 Decision node A repre-
sents the company’s facility size decision, with the two possible choices shown on the
branches extending from the decision node (“build large facility” and “build small
facility”). Chance nodes B and C represent the lotteries the company faces depending
on its decision at node A. Each lottery has two possible outcomes, shown on the
branches extending from the chance nodes (“reservoir is large” and “reservoir is
small”), and the probability of each outcome is 0.50. The company’s profit depends on
the decision made at node A and the actual outcome of the corresponding lottery.
That is, if the company decides at node A to build a large facility, profit will be either
$50 million (if the reservoir is large) or $10 million (if the reservoir is small); if the
company decides at node A to build a small facility, profit will be either $30 million
(if the reservoir is large) or $20 million (if the reservoir is small).
To choose its optimal plan of action, the oil company would begin by calculating the
expected value of each lottery 12 and then choose the decision at node A that leads to the
lottery with the higher expected value. Thus, the company would evaluate the tree by
working backward, from right to left. This is called folding the tree back and is identical to
the process of backward induction that we used to analyze game trees in Chapter 14.
11 If we had assumed that the firm was risk averse, we would need to specify a utility function for the firm
and evaluate the utility of the profit of each outcome.
12 If the firm were risk averse, it would evaluate the expected utility of the payoffs using the firm’s utility
function.