
Page 657 - Microeconomics, Fourth Edition
P. 657
c15riskandinformation.qxd 8/16/10 11:10 AM Page 631
15.4 ANALYZING RISKY DECISIONS 631
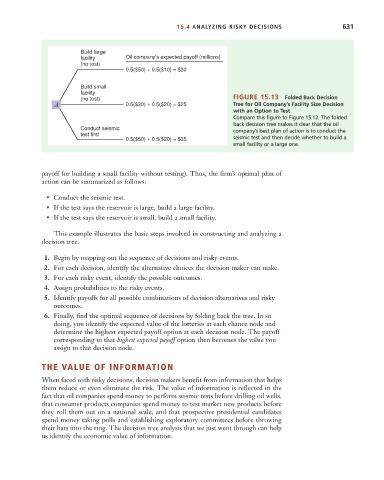
Build large
facility Oil company's expected payoff (millions)
(no test)
0.5($50) + 0.5($10) = $30
Build small
facility
(no test) FIGURE 15.13 Folded Back Decision
A 0.5($30) + 0.5($20) = $25 Tree for Oil Company’s Facility Size Decision
with an Option to Test
Compare this figure to Figure 15.12. The folded
back decision tree makes it clear that the oil
Conduct seismic company’s best plan of action is to conduct the
test first
0.5($50) + 0.5($20) = $35 seismic test and then decide whether to build a
small facility or a large one.
payoff for building a small facility without testing). Thus, the firm’s optimal plan of
action can be summarized as follows:
• Conduct the seismic test.
• If the test says the reservoir is large, build a large facility.
• If the test says the reservoir is small, build a small facility.
This example illustrates the basic steps involved in constructing and analyzing a
decision tree.
1. Begin by mapping out the sequence of decisions and risky events.
2. For each decision, identify the alternative choices the decision maker can make.
3. For each risky event, identify the possible outcomes.
4. Assign probabilities to the risky events.
5. Identify payoffs for all possible combinations of decision alternatives and risky
outcomes.
6. Finally, find the optimal sequence of decisions by folding back the tree. In so
doing, you identify the expected value of the lotteries at each chance node and
determine the highest expected payoff option at each decision node. The payoff
corresponding to that highest expected payoff option then becomes the value you
assign to that decision node.
THE VALUE OF INFORMATION
When faced with risky decisions, decision makers benefit from information that helps
them reduce or even eliminate the risk. The value of information is reflected in the
fact that oil companies spend money to perform seismic tests before drilling oil wells,
that consumer products companies spend money to test market new products before
they roll them out on a national scale, and that prospective presidential candidates
spend money taking polls and establishing exploratory committees before throwing
their hats into the ring. The decision tree analysis that we just went through can help
us identify the economic value of information.