
Page 655 - Microeconomics, Fourth Edition
P. 655
c15riskandinformation.qxd 8/16/10 11:10 AM Page 629
15.4 ANALYZING RISKY DECISIONS 629
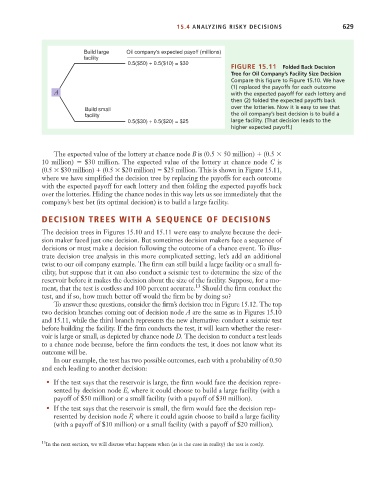
Build large Oil company's expected payoff (millions)
facility
0.5($50) + 0.5($10) = $30
FIGURE 15.11 Folded Back Decision
Tree for Oil Company’s Facility Size Decision
Compare this figure to Figure 15.10. We have
(1) replaced the payoffs for each outcome
A with the expected payoff for each lottery and
then (2) folded the expected payoffs back
Build small over the lotteries. Now it is easy to see that
facility the oil company’s best decision is to build a
0.5($30) + 0.5($20) = $25 large facility. (That decision leads to the
higher expected payoff.)
The expected value of the lottery at chance node B is (0.5 50 million) (0.5
10 million) $30 million. The expected value of the lottery at chance node C is
(0.5 $30 million) (0.5 $20 million) $25 million. This is shown in Figure 15.11,
where we have simplified the decision tree by replacing the payoffs for each outcome
with the expected payoff for each lottery and then folding the expected payoffs back
over the lotteries. Hiding the chance nodes in this way lets us see immediately that the
company’s best bet (its optimal decision) is to build a large facility.
DECISION TREES WITH A SEQUENCE OF DECISIONS
The decision trees in Figures 15.10 and 15.11 were easy to analyze because the deci-
sion maker faced just one decision. But sometimes decision makers face a sequence of
decisions or must make a decision following the outcome of a chance event. To illus-
trate decision tree analysis in this more complicated setting, let’s add an additional
twist to our oil company example. The firm can still build a large facility or a small fa-
cility, but suppose that it can also conduct a seismic test to determine the size of the
reservoir before it makes the decision about the size of the facility. Suppose, for a mo-
ment, that the test is costless and 100 percent accurate. 13 Should the firm conduct the
test, and if so, how much better off would the firm be by doing so?
To answer these questions, consider the firm’s decision tree in Figure 15.12. The top
two decision branches coming out of decision node A are the same as in Figures 15.10
and 15.11, while the third branch represents the new alternative: conduct a seismic test
before building the facility. If the firm conducts the test, it will learn whether the reser-
voir is large or small, as depicted by chance node D. The decision to conduct a test leads
to a chance node because, before the firm conducts the test, it does not know what its
outcome will be.
In our example, the test has two possible outcomes, each with a probability of 0.50
and each leading to another decision:
• If the test says that the reservoir is large, the firm would face the decision repre-
sented by decision node E, where it could choose to build a large facility (with a
payoff of $50 million) or a small facility (with a payoff of $30 million).
• If the test says that the reservoir is small, the firm would face the decision rep-
resented by decision node F, where it could again choose to build a large facility
(with a payoff of $10 million) or a small facility (with a payoff of $20 million).
13 In the next section, we will discuss what happens when (as is the case in reality) the test is costly.