
Page 229 - Economics
P. 229
CONFIRMING PAGES
PART THREE
200
Macroeconomic Models and Fiscal Policy
today. So, as indicated in this chapter’s Last Word, the U.
CONSIDER THIS . . .
S. economy is now less vulnerable to cost-push inflation
arising from such “aggregate supply shocks.”
Ratchet Effect
A ratchet analogy is a good Increases in AS: Full Employment
way to think about effects
of changes in aggregate de- with Price-Level Stability
mand on the price level. A Between 1996 and 2000, the United States experienced a
ratchet is a tool or mecha- combination of full employment, strong economic
nism such as a winch, car growth, and very low inflation. Specifically, the unem-
jack, or socket wrench that ployment rate fell to 4 percent and real GDP grew nearly
cranks a wheel forward but 4 percent annually, without igniting inflation . At first
does not allow it to go
backward. Properly set, each thought, this “macroeconomic bliss” seems to be incom-
allows the operator to patible with the AD-AS model. The aggregate supply
move an object (boat, car, or curve suggests that increases in aggregate demand that
nut) in one direction while are sufficient for over-full employment will raise the price
preventing it from moving in level (see Figure 10.7 ). Higher inflation, so it would seem,
the opposite direction. is the inevitable price paid for expanding output beyond
Product prices, wage rates, and per-unit production costs the full-employment level.
are highly flexible upward when aggregate demand increases But inflation remained very mild in the late 1990s. Fig-
along the aggregate supply curve. In the United States, the ure 10.10 helps explain why. Let’s first suppose that aggre-
price level has increased in 55 of the 56 years since 1950. gate demand increased from AD to AD along aggregate
1
2
But when aggregate demand decreases, product prices, supply curve AS . Taken alone, that increase in aggre-
wage rates, and per-unit production costs are inflexible down- 1
ward. The U.S. price level has declined in only a single year gate demand would move the economy from a to b . Real
(1955) since 1950, even though aggregate demand and real output would rise from full-employment output Q to be-
1
output have declined in a number of years. yond-full-employment output Q . The economy would
2
In terms of our analogy, increases in aggregate demand experience inflation, as shown by the increase in the price
ratchet the U.S. price level upward. Once in place, the higher level from P to P . Such inflation had occurred at the end
1
3
price level remains until it is ratcheted up again. The higher price
level tends to remain even with declines in aggregate demand.
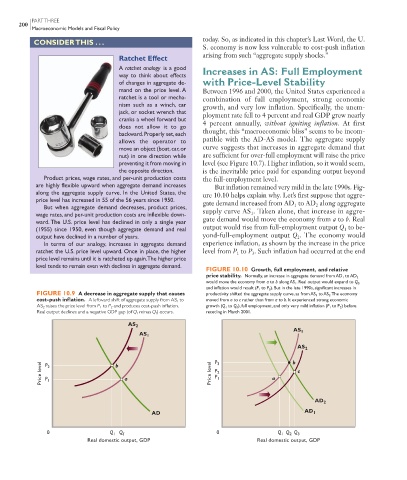
FIGURE 10.10 Growth, full employment, and relative
price stability. Normally, an increase in aggregate demand from AD 1 to AD 2
would move the economy from a to b along AS 1 . Real output would expand to Q 2 ,
and inflation would result (P 1 to P 3 ). But in the late 1990s, significant increases in
FIGURE 10.9 A decrease in aggregate supply that causes productivity shifted the aggregate supply curve, as from AS 1 to AS 2 . The economy
cost-push inflation. A leftward shift of aggregate supply from AS 1 to moved from a to c rather than from a to b. It experienced strong economic
AS 2 raises the price level from P 1 to P 2 and produces cost-push inflation. growth (Q 1 to Q 3 ), full employment, and only very mild inflation (P 1 to P 2 ) before
Real output declines and a negative GDP gap (of Q 1 minus Q f ) occurs. receding in March 2001.
AS 2
AS 1
AS 1
AS 2
Price level P 2 b a Price level P 3 a b c
P 2
P 1
P 1
AD 2
AD AD 1
0 Q 1 Q f 0 Q 1 Q 2 Q 3
Real domestic output, GDP Real domestic output, GDP
8/21/06 4:51:10 PM
mcc26632_ch10_187-207.indd 200 8/21/06 4:51:10 PM
mcc26632_ch10_187-207.indd 200