
Page 227 - Economics
P. 227
CONFIRMING PAGES
PART THREE
198
Macroeconomic Models and Fiscal Policy
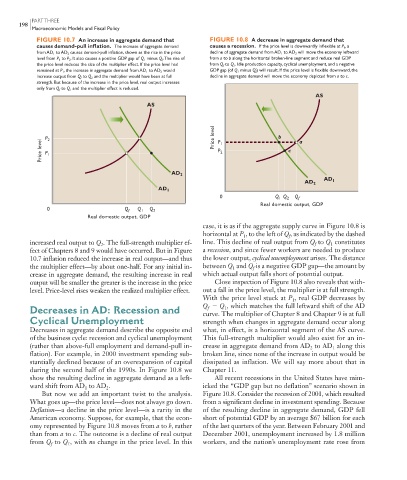
FIGURE 10.7 An increase in aggregate demand that FIGURE 10.8 A decrease in aggregate demand that
causes demand-pull inflation. The increase of aggregate demand causes a recession. If the price level is downwardly inflexible at P 1 , a
from AD 1 to AD 2 causes demand-pull inflation, shown as the rise in the price decline of aggregate demand from AD 1 to AD 2 will move the economy leftward
level from P 1 to P 2 . It also causes a positive GDP gap of Q 1 minus Q f . The rise of from a to b along the horizontal broken-line segment and reduce real GDP
the price level reduces the size of the multiplier effect. If the price level had from Q f to Q 1 . Idle production capacity, cyclical unemployment, and a negative
remained at P 1 , the increase in aggregate demand from AD 1 to AD 2 would GDP gap (of Q 1 minus Q f ) will result. If the price level is flexible downward, the
increase output from Q f to Q 2 and the multiplier would have been at full decline in aggregate demand will move the economy depicted from a to c.
strength. But because of the increase in the price level, real output increases
only from Q f to Q 1 and the multiplier effect is reduced.
AS
AS
Price level P 2 Price level P 1 b c a
P 2
P 1
AD 2
AD 1
AD 2
AD 1
0 Q 1 Q 2 Q f
Real domestic output, GDP
0 Q f Q 1 Q 2
Real domestic output, GDP
case, it is as if the aggregate supply curve in Figure 10.8 is
horizontal at P , to the left of Q , as indicated by the dashed
f
1
increased real output to Q . The full-strength multiplier ef- line. This decline of real output from Q to Q constitutes
f
1
2
fect of Chapters 8 and 9 would have occurred. But in Figure a recession , and since fewer workers are needed to produce
10.7 inflation reduced the increase in real output—and thus the lower output, cyclical unemployment arises. The distance
the multiplier effect—by about one-half. For any initial in- between Q and Q is a negative GDP gap—the amount by
f
1
crease in aggregate demand, the resulting increase in real which actual output falls short of potential output.
output will be smaller the greater is the increase in the price Close inspection of Figure 10.8 also reveals that with-
level. Price-level rises weaken the realized multiplier effect. out a fall in the price level, the multiplier is at full strength.
With the price level stuck at P , real GDP decreases by
1
Q Q , which matches the full leftward shift of the AD
Decreases in AD: Recession and curve. The multiplier of Chapter 8 and Chapter 9 is at full
1
f
Cyclical Unemployment strength when changes in aggregate demand occur along
Decreases in aggregate demand describe the opposite end what, in effect, is a horizontal segment of the AS curve.
of the business cycle: recession and cyclical unemployment This full-strength multiplier would also exist for an in-
(rather than above-full employment and demand-pull in- crease in aggregate demand from AD to AD along this
2
1
flation). For example, in 2000 investment spending sub- broken line, since none of the increase in output would be
stantially declined because of an overexpansion of capital dissipated as inflation. We will say more about that in
during the second half of the 1990s. In Figure 10.8 we Chapter 11.
show the resulting decline in aggregate demand as a left- All recent recessions in the United States have mim-
ward shift from AD to AD . icked the “GDP gap but no deflation” scenario shown in
1
2
But now we add an important twist to the analysis. Figure 10.8 . Consider the recession of 2001, which resulted
What goes up—the price level—does not always go down. from a significant decline in investment spending. Because
Deflation —a decline in the price level—is a rarity in the of the resulting decline in aggregate demand, GDP fell
American economy. Suppose, for example, that the econ- short of potential GDP by an average $67 billion for each
omy represented by Figure 10.8 moves from a to b , rather of the last quarters of the year. Between February 2001 and
than from a to c . The outcome is a decline of real output December 2001, unemployment increased by 1.8 million
to Q , with no change in the price level. In this workers, and the nation’s unemployment rate rose from
from Q f 1
8/21/06 4:51:10 PM
mcc26632_ch10_187-207.indd 198 8/21/06 4:51:10 PM
mcc26632_ch10_187-207.indd 198