
Page 222 - Economics
P. 222
CONFIRMING PAGES
CHAPTER 10
193
Aggregate Demand and Aggregate Supply
Aggregate Supply in the The per-unit production cost of any specific level of
Short Run output establishes that output’s price level because the
price level must cover all the costs of production, in-
In reality, nominal wages do not immediately adjust to cluding profit “costs.”
changes in the price level and perfect adjustment may take As the economy expands in the short run, per-unit
several months or even a number of years. Reconsider our production costs generally rise because of reduced effi-
previous one-firm economy. If the $8 nominal wage for ciency. But the extent of that rise depends on where the
each of the 10 workers is unresponsive to the price-level economy is operating relative to its capacity. The aggre-
change, the doubling of the price level will boost total rev- gate supply curve in Figure 10.4 is relatively flat at outputs
enue from $100 to $200 but leave total cost unchanged at below the full-employment output Q and relatively steep
ƒ
$80. Nominal profit will rise from $20 ( $100 $80) to at outputs above it. Why the difference?
$120 ( $200 $80). Dividing that $120 profit by the When the economy is operating below its full-
new price index of 200 ( 2.0 in hundredths), we find that employment output, it has large amounts of unused
the real profit is now $60. The rise in the real reward from machinery and equipment and unemployed workers.
$20 to $60 prompts the firm (economy) to produce more Firms can put these idle human and property resources
output. Conversely, price-level declines reduce real profits back to work with little upward pressure on per-unit pro-
and cause the firm (economy) to reduce its output. So, in duction costs. And as output expands, few if any shortages
the short run, there is a direct or positive relationship of inputs or production bottlenecks will arise to raise per-
between the price level and real output. unit production costs.
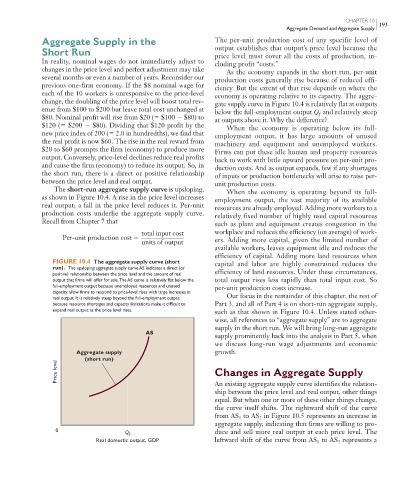
The short-run aggregate supply curve is upsloping, When the economy is operating beyond its full-
as shown in Figure 10.4 . A rise in the price level increases employment output, the vast majority of its available
real output; a fall in the price level reduces it. Per-unit resources are already employed. Adding more workers to a
production costs underlie the aggregate supply curve. relatively fixed number of highly used capital resources
Recall from Chapter 7 that such as plant and equipment creates congestion in the
total input cost workplace and reduces the efficiency (on average) of work-
Per-unit production cost _____________ ers. Adding more capital, given the limited number of
units of output
available workers, leaves equipment idle and reduces the
efficiency of capital. Adding more land resources when
FIGURE 10.4 The aggregate supply curve (short capital and labor are highly constrained reduces the
run). The upsloping aggregate supply curve AS indicates a direct (or
positive) relationship between the price level and the amount of real efficiency of land resources. Under these circumstances,
output that firms will offer for sale. The AS curve is relatively flat below the total output rises less rapidly than total input cost. So
full-employment output because unemployed resources and unused per-unit production costs increase.
capacity allow firms to respond to price-level rises with large increases in
real output. It is relatively steep beyond the full-employment output Our focus in the remainder of this chapter, the rest of
because resource shortages and capacity limitations make it difficult to Part 3, and all of Part 4 is on short-run aggregate supply,
expand real output as the price level rises. such as that shown in Figure 10.4 . Unless stated other-
wise, all references to “aggregate supply” are to aggregate
supply in the short run. We will bring long-run aggregate
AS
supply prominently back into the analysis in Part 5, when
we discuss long-run wage adjustments and economic
Aggregate supply growth.
(short run)
Price level Changes in Aggregate Supply
An existing aggregate supply curve identifies the relation-
ship between the price level and real output, other things
equal. But when one or more of these other things change,
the curve itself shifts. The rightward shift of the curve
from AS to AS in Figure 10.5 represents an increase in
2
1
aggregate supply, indicating that firms are willing to pro-
0 duce and sell more real output at each price level. The
Q f
Real domestic output, GDP leftward shift of the curve from AS to AS represents a
3
1
mcc26632_ch10_187-207.indd 193 8/21/06 4:51:09 PM
8/21/06 4:51:09 PM
mcc26632_ch10_187-207.indd 193