Page 226 - Economics
P. 226

CONFIRMING PAGES


                     keygraph


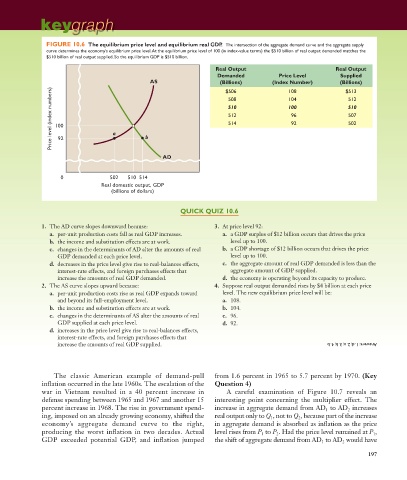
                      FIGURE 10.6  The equilibrium price level and equilibrium real GDP.  The intersection of the aggregate demand curve and the aggregate supply
                      curve determines the economy’s equilibrium price level. At the equilibrium price level of 100 (in index-value terms) the $510 billion of real output demanded matches the
                      $510 billion of real output supplied. So the equilibrium GDP is $510 billion.
                                                                         Real Output                         Real Output
                                                                          Demanded          Price Level        Supplied
                                                     AS                   (Billions)      (Index Number)      (Billions)
                        Price level (index numbers)  100  a  b               512               100               507
                                                                                                                $513
                                                                            $506
                                                                                               108
                                                                             508
                                                                                                                 512
                                                                                               104
                                                                                                                 510
                                                                             510
                                                                                                96
                                                                                                92
                                                                                                                 502
                                                                             514
                          92
                                                         AD
                          0              502   510 514
                                       Real domestic output, GDP
                                          (billions of dollars)


                                                              QUICK QUIZ 10.6
                     1.  The AD curve slopes downward because:           3.  At price level 92:
                       a.  per-unit production costs fall as real GDP increases.  a.   a GDP surplus of $12 billion occurs that drives the price
                       b.  the income and substitution effects are at work.   level up to 100.
                       c.   changes in the determinants of AD alter the amounts of real   b.   a GDP shortage of $12 billion occurs that drives the price
                          GDP demanded at each price level.                   level up to 100.
                       d.   decreases in the price level give rise to real-balances effects,   c.   the aggregate amount of real GDP demanded is less than the
                          interest-rate effects, and foreign purchases effects that   aggregate amount of GDP supplied.
                          increase the amounts of real GDP demanded.       d.  the economy is operating beyond its capacity to produce.
                     2.  The AS curve slopes upward because:             4.  Suppose real output demanded rises by $4 billion at each price
                       a.   per-unit production costs rise as real GDP expands toward   level. The new equilibrium price level will be:
                          and beyond its full-employment level.            a.  108.
                       b.  the income and substitution effects are at work.  b.  104.
                       c.   changes in the determinants of AS alter the amounts of real   c.  96.
                          GDP supplied at each price level.                d.  92.
                       d.   increases in the price level give rise to real-balances effects,
                          interest-rate effects, and foreign purchases effects that
                          increase the amounts of real GDP supplied.                                                      Answers: 1. d; 2. a; 3. b; 4. b


                          The classic American example of demand-pull    from 1.6 percent in 1965 to 5.7 percent by 1970.  (Key
                     inflation occurred in the late 1960s. The escalation of the   Question 4)
                     war in Vietnam resulted in a 40 percent increase in        A careful examination of  Figure 10.7  reveals an
                     defense spending between 1965 and 1967 and another 15   interesting point concerning the multiplier effect. The
                     percent increase in 1968. The rise in government spend-  increase in aggregate demand from AD  1    to AD   increases
                                                                                                                 2
                     ing, imposed on an already growing economy, shifted the   real output only to  Q   , not to  Q   , because part of the increase
                                                                                          1
                                                                                                  2
                     economy’s aggregate demand curve to the right,      in aggregate demand is absorbed as inflation as the price
                     producing the worst inflation in two decades. Actual   level rises from  P    to  P   . Had the price level remained at  P   ,
                                                                                                                        1
                                                                                           2
                                                                                       1
                     GDP exceeded potential GDP, and inflation jumped    the shift of aggregate demand from AD   to AD   would have
                                                                                                               2
                                                                                                         1
                                                                                                                       197

                                                                                                                       8/21/06   4:51:10 PM
          mcc26632_ch10_187-207.indd   197
          mcc26632_ch10_187-207.indd   197                                                                             8/21/06   4:51:10 PM
   221   222   223   224   225   226   227   228   229   230   231