
Page 337 - Economics
P. 337
CONFIRMING PAGES
CHAPTER 15
289
Extending the Analysis of Aggregate Supply
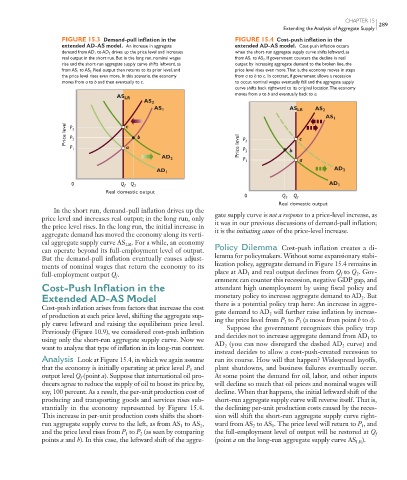
FIGURE 15.3 Demand-pull inflation in the FIGURE 15.4 Cost-push inflation in the
extended AD-AS model. An increase in aggregate extended AD-AS model. Cost-push inflation occurs
demand from AD 1 to AD 2 drives up the price level and increases when the short-run aggregate supply curve shifts leftward, as
real output in the short run. But in the long run, nominal wages from AS 1 to AS 2 . If government counters the decline in real
rise and the short-run aggregate supply curve shifts leftward, as output by increasing aggregate demand to the broken line, the
from AS 1 to AS 2 . Real output then returns to its prior level, and price level rises even more. That is, the economy moves in steps
the price level rises even more. In this scenario, the economy from a to b to c. In contrast, if government allows a recession
moves from a to b and then eventually to c. to occur, nominal wages eventually fall and the aggregate supply
curve shifts back rightward to its original location. The economy
moves from a to b and eventually back to a.
AS LR
AS 2
AS 1 AS LR AS 2
AS 1
Price level P 3 c b P 3 c
P 2
P 1 a Price level P 2 b
AD 2
P 1 a
AD 2
AD 1
0 Q f Q 2 AD 1
Real domestic output
0 Q 2 Q f
Real domestic output
In the short run, demand-pull inflation drives up the
price level and increases real output; in the long run, only gate supply curve is not a response to a price-level increase, as
the price level rises. In the long run, the initial increase in it was in our previous discussions of demand-pull inflation;
aggregate demand has moved the economy along its verti- it is the initiating cause of the price-level increase.
cal aggregate supply curve AS . For a while, an economy
LR
can operate beyond its full-employment level of output. Policy Dilemma Cost-push inflation creates a di-
But the demand-pull inflation eventually causes adjust- lemma for policymakers. Without some expansionary stabi-
ments of nominal wages that return the economy to its lization policy, aggregate demand in Figure 15.4 remains in
full-employment output Q . place at AD and real output declines from Q to Q . Gov-
f
1
2
f
ernment can counter this recession, negative GDP gap, and
Cost-Push Inflation in the attendant high unemployment by using fiscal policy and
Extended AD-AS Model monetary policy to increase aggregate demand to AD . But
2
Cost-push inflation arises from factors that increase the cost there is a potential policy trap here: An increase in aggre-
gate demand to AD will further raise inflation by increas-
2
of production at each price level, shifting the aggregate sup- ing the price level from P to P (a move from point b to c ).
3
2
ply curve leftward and raising the equilibrium price level. Suppose the government recognizes this policy trap
Previously (Figure 10.9), we considered cost-push inflation and decides not to increase aggregate demand from AD to
1
using only the short-run aggregate supply curve. Now we AD (you can now disregard the dashed AD curve) and
want to analyze that type of inflation in its long-run context. 2 2
instead decides to allow a cost-push-created recession to
Analysis Look at Figure 15.4 , in which we again assume run its course. How will that happen? Widespread layoffs,
that the economy is initially operating at price level P and plant shutdowns, and business failures eventually occur.
1
output level Q (point a ). Suppose that international oil pro- At some point the demand for oil, labor, and other inputs
f
ducers agree to reduce the supply of oil to boost its price by, will decline so much that oil prices and nominal wages will
say, 100 percent. As a result, the per-unit production cost of decline. When that happens, the initial leftward shift of the
producing and transporting goods and services rises sub- short-run aggregate supply curve will reverse itself. That is,
stantially in the economy represented by Figure 15.4 . the declining per-unit production costs caused by the reces-
This increase in per-unit production costs shifts the short- sion will shift the short-run aggregate supply curve right-
to AS , to AS . The price level will return to P , and
run aggregate supply curve to the left, as from AS 1 2 ward from AS 2 1 1
and the price level rises from P to P (as seen by comparing the full-employment level of output will be restored at Q
2
f
1
points a and b ). In this case, the leftward shift of the aggre- (point a on the long-run aggregate supply curve AS ).
LR
mcc26632_ch15_284-301.indd 289 9/1/06 3:17:09 PM
mcc26632_ch15_284-301.indd 289
9/1/06 3:17:09 PM