
Page 341 - Economics
P. 341
CONFIRMING PAGES
CHAPTER 15
293
Extending the Analysis of Aggregate Supply
1960s. In fact, inflation and unemployment rose simultane- With so many workers unemployed, those who were
ously in some of those years. This condition is called stag- working accepted smaller increases in their nominal
flation —a media term that combines the words “stagnation” wages—or, in some cases, wage reductions—in order to
and “inflation.” If there still was any such thing as a Phillips preserve their jobs. Firms, in turn, restrained their price
Curve, it had clearly shifted outward, perhaps as shown. increases to try to retain their relative shares of a greatly
diminished market.
Adverse Aggregate Supply Shocks The Other factors were at work. Foreign competition
Phillips data points for the 1970s and early 1980s support throughout this period held down wage and price hikes in
our second generalization: Aggregate supply shocks can several basic industries such as automobiles and steel. De-
cause both higher rates of inflation and higher rates of un- regulation of the airline and trucking industries also
employment. A series of adverse aggregate supply resulted in wage reductions or so-called wage givebacks. A
shocks —sudden, large increases in resource costs that jolt significant decline in OPEC’s monopoly power and a
an economy’s short-run aggregate supply curve leftward— greatly reduced reliance on oil in the production process
hit the economy in the 1970s and early 1980s. The most produced a stunning fall in the price of oil and its deriva-
significant of these shocks was a quadrupling of oil prices tive products, such as gasoline.
by the Organization of Petroleum Exporting Countries All these factors combined to reduce per-unit pro-
(OPEC). Consequently, the cost of producing and distrib- duction costs and to shift the short-run aggregate supply
uting virtually every product and service rose rapidly. curve rightward (as from AS to AS in Figure 15.4 ). Em-
2
1
(Other factors working to increase U.S. costs during this ployment and output expanded, and the unemployment
period included major agricultural shortfalls, a greatly de- rate fell from 9.6 percent in 1983 to 5.3 percent in 1989.
preciated dollar, wage hikes previously held down by Figure 15.8 reveals that the inflation-unemployment
wage-price controls, and declining productivity.) points for recent years are closer to the points associated
These shocks shifted the aggregate supply curve to with the Phillips Curve of the 1960s than to the points in
the left and distorted the usual inflation-unemployment
relationship. Remember that we derived the inverse
relationship between the rate of inflation and the unem-
ployment rate shown in Figure 15.6a by shifting the GLOBAL PERSPECTIVE 15.1
aggregate demand curve along a stable short-run aggre-
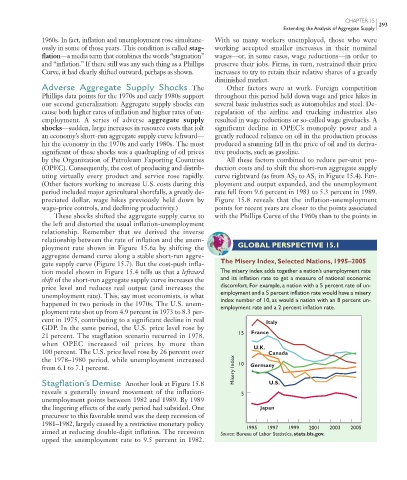
gate supply curve ( Figure 15.7 ). But the cost-push infla- The Misery Index, Selected Nations, 1995–2005
tion model shown in Figure 15.4 tells us that a leftward The misery index adds together a nation’s unemployment rate
shift of the short-run aggregate supply curve increases the and its inflation rate to get a measure of national economic
price level and reduces real output (and increases the discomfort. For example, a nation with a 5 percent rate of un-
unemployment rate). This, say most economists, is what employment and a 5 percent inflation rate would have a misery
happened in two periods in the 1970s. The U.S. unem- index number of 10, as would a nation with an 8 percent un-
employment rate and a 2 percent inflation rate.
ployment rate shot up from 4.9 percent in 1973 to 8.3 per-
cent in 1975, contributing to a significant decline in real Italy
GDP. In the same period, the U.S. price level rose by
21 percent. The stagflation scenario recurred in 1978, 15 France
when OPEC increased oil prices by more than U.K.
100 percent. The U.S. price level rose by 26 percent over Canada
the 1978–1980 period, while unemployment increased 10
from 6.1 to 7.1 percent. Misery Index Germany
Stagflation’s Demise Another look at Figure 15.8 U.S.
reveals a generally inward movement of the inflation- 5
unemployment points between 1982 and 1989. By 1989
the lingering effects of the early period had subsided. One Japan
precursor to this favorable trend was the deep recession of
1981–1982, largely caused by a restrictive monetary policy 1995 1997 1999 2001 2003 2005
aimed at reducing double-digit inflation. The recession Source: Bureau of Labor Statistics, stats.bls.gov.
upped the unemployment rate to 9.5 percent in 1982.
mcc26632_ch15_284-301.indd 293 9/1/06 3:17:10 PM
9/1/06 3:17:10 PM
mcc26632_ch15_284-301.indd 293