
Page 343 - Economics
P. 343
CONFIRMING PAGES
CHAPTER 15
295
Extending the Analysis of Aggregate Supply
catch up with price-level increases, unemployment returns rate of inflation is now 6 percent, the short-run Phillips
to its natural rate at a , and there is a new short-run Phillips Curve PC shifts leftward to PC .
2
2
3
Curve PC at the higher expected rate of inflation. If aggregate demand declines more, the scenario will
2
The scenario repeats if aggregate demand continues to continue. Inflation declines from 6 percent to, say, 3 per-
increase. Prices rise momentarily ahead of nominal wages, cent, moving the economy from a 2 to c 2 along PC 2 . The
profits expand, and employment and output increase (as im- lower-than-expected rate of inflation (lower prices)
plied by the move from a to b ). But, in time, nominal wages squeezes profits and reduces employment. But, in the long
2
2
increase so as to restore real wages. Profits then fall to their run, firms respond to the lower profits by reducing their
original level, pushing employment back to the normal rate nominal wage increases. Profits are restored and unem-
at a . The economy’s “reward” for lowering the unemploy- ployment returns to its natural rate at a as the short-run
3
1
ment rate below the natural rate is a still higher (9 percent) Phillips Curve moves from PC to PC . Once again, the
2
1
rate of inflation. long-run Phillips Curve is vertical at the 5 percent natural
Movements along the short-run Phillips curve ( a to rate of unemployment. (Key Question 6)
1
b on PC ) cause the curve to shift to a less favorable posi-
1
1
tion (PC , then PC , and so on). A stable Phillips Curve QUICK REVIEW 15.3
2
3
with the dependable series of unemployment-rate–infla-
tion-rate tradeoffs simply does not exist in the long run. • As implied by the upward-sloping short-run aggregate
The economy is characterized by a long-run vertical supply curve, there may be a short-run tradeoff between the
Phillips Curve . rate of inflation and the rate of unemployment. This tradeoff
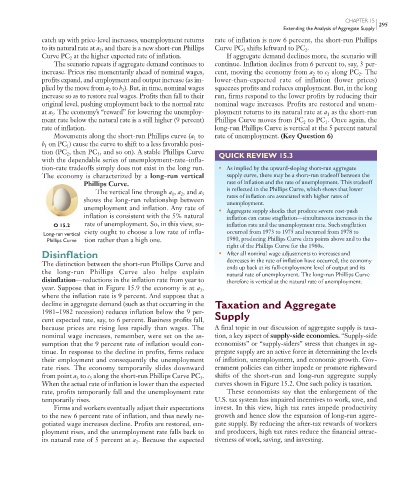
, a , and a is reflected in the Phillips Curve, which shows that lower
The vertical line through a 1 2 3 rates of inflation are associated with higher rates of
shows the long-run relationship between unemployment.
unemployment and inflation. Any rate of • Aggregate supply shocks that produce severe cost-push
inflation is consistent with the 5% natural inflation can cause stagflation—simultaneous increases in the
O 15.2 rate of unemployment. So, in this view, so- inflation rate and the unemployment rate. Such stagflation
ciety ought to choose a low rate of infla- occurred from 1973 to 1975 and recurred from 1978 to
Long-run vertical
Phillips Curve tion rather than a high one. 1980, producing Phillips Curve data points above and to the
right of the Phillips Curve for the 1960s.
Disinflation • After all nominal wage adjustments to increases and
The distinction between the short-run Phillips Curve and decreases in the rate of inflation have occurred, the economy
ends up back at its full-employment level of output and its
the long-run Phillips Curve also helps explain natural rate of unemployment. The long-run Phillips Curve
disinflation —reductions in the inflation rate from year to therefore is vertical at the natural rate of unemployment.
year. Suppose that in Figure 15.9 the economy is at a ,
3
where the inflation rate is 9 percent. And suppose that a
decline in aggregate demand (such as that occurring in the Taxation and Aggregate
1981–1982 recession) reduces inflation below the 9 per-
cent expected rate, say, to 6 percent. Business profits fall, Supply
because prices are rising less rapidly than wages. The A final topic in our discussion of aggregate supply is taxa-
nominal wage increases, remember, were set on the as- tion, a key aspect of supply-side economics . “Supply-side
sumption that the 9 percent rate of inflation would con- economists” or “supply-siders” stress that changes in ag-
tinue. In response to the decline in profits, firms reduce gregate supply are an active force in determining the levels
their employment and consequently the unemployment of inflation, unemployment, and economic growth. Gov-
rate rises. The economy temporarily slides downward ernment policies can either impede or promote rightward
from point a to c along the short-run Phillips Curve PC . shifts of the short-run and long-run aggregate supply
3
3
3
When the actual rate of inflation is lower than the expected curves shown in Figure 15.2 . One such policy is taxation.
rate, profits temporarily fall and the unemployment rate These economists say that the enlargement of the
temporarily rises. U.S. tax system has impaired incentives to work, save, and
Firms and workers eventually adjust their expectations invest. In this view, high tax rates impede productivity
to the new 6 percent rate of inflation, and thus newly ne- growth and hence slow the expansion of long-run aggre-
gotiated wage increases decline. Profits are restored, em- gate supply. By reducing the after-tax rewards of workers
ployment rises, and the unemployment rate falls back to and producers, high tax rates reduce the financial attrac-
its natural rate of 5 percent at a . Because the expected tiveness of work, saving, and investing.
2
mcc26632_ch15_284-301.indd 295 9/1/06 3:17:11 PM
9/1/06 3:17:11 PM
mcc26632_ch15_284-301.indd 295