
Page 345 - Economics
P. 345
CONFIRMING PAGES
CHAPTER 15
297
Extending the Analysis of Aggregate Supply
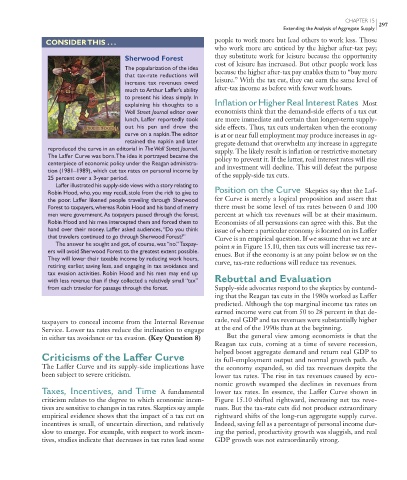
CONSIDER THIS . . . people to work more but lead others to work less. Those
who work more are enticed by the higher after-tax pay;
Sherwood Forest they substitute work for leisure because the opportunity
cost of leisure has increased. But other people work less
The popularization of the idea because the higher after-tax pay enables them to “buy more
that tax-rate reductions will
increase tax revenues owed leisure.” With the tax cut, they can earn the same level of
much to Arthur Laffer’s ability after-tax income as before with fewer work hours.
to present his ideas simply. In
explaining his thoughts to a Inflation or Higher Real Interest Rates Most
Wall Street Journal editor over economists think that the demand-side effects of a tax cut
lunch, Laffer reportedly took are more immediate and certain than longer-term supply-
out his pen and drew the side effects. Thus, tax cuts undertaken when the economy
curve on a napkin. The editor is at or near full employment may produce increases in ag-
retained the napkin and later gregate demand that overwhelm any increase in aggregate
reproduced the curve in an editorial in The Wall Street Journal. supply. The likely result is inflation or restrictive monetary
The Laffer Curve was born. The idea it portrayed became the policy to prevent it. If the latter, real interest rates will rise
centerpiece of economic policy under the Reagan administra- and investment will decline. This will defeat the purpose
tion (1981–1989), which cut tax rates on personal income by
25 percent over a 3-year period. of the supply-side tax cuts.
Laffer illustrated his supply-side views with a story relating to
Robin Hood, who, you may recall, stole from the rich to give to Position on the Curve Skeptics say that the Laf-
the poor. Laffer likened people traveling through Sherwood fer Curve is merely a logical proposition and assert that
Forest to taxpayers, whereas Robin Hood and his band of merry there must be some level of tax rates between 0 and 100
men were government. As taxpayers passed through the forest, percent at which tax revenues will be at their maximum.
Robin Hood and his men intercepted them and forced them to Economists of all persuasions can agree with this. But the
hand over their money. Laffer asked audiences, “Do you think issue of where a particular economy is located on its Laffer
that travelers continued to go through Sherwood Forest?” Curve is an empirical question. If we assume that we are at
The answer he sought and got, of course, was “no.” Taxpay- point n in Figure 15.10 , then tax cuts will increase tax rev-
ers will avoid Sherwood Forest to the greatest extent possible. enues. But if the economy is at any point below m on the
They will lower their taxable income by reducing work hours, curve, tax-rate reductions will reduce tax revenues.
retiring earlier, saving less, and engaging in tax avoidance and
tax evasion activities. Robin Hood and his men may end up
with less revenue than if they collected a relatively small “tax” Rebuttal and Evaluation
from each traveler for passage through the forest. Supply-side advocates respond to the skeptics by contend-
ing that the Reagan tax cuts in the 1980s worked as Laffer
predicted. Although the top marginal income tax rates on
earned income were cut from 50 to 28 percent in that de-
taxpayers to conceal income from the Internal Revenue cade, real GDP and tax revenues were substantially higher
Service. Lower tax rates reduce the inclination to engage at the end of the 1990s than at the beginning.
in either tax avoidance or tax evasion. (Key Question 8) But the general view among economists is that the
Reagan tax cuts, coming at a time of severe recession,
helped boost aggregate demand and return real GDP to
Criticisms of the Laffer Curve its full-employment output and normal growth path. As
The Laffer Curve and its supply-side implications have the economy expanded, so did tax revenues despite the
been subject to severe criticism. lower tax rates. The rise in tax revenues caused by eco-
nomic growth swamped the declines in revenues from
Taxes, Incentives, and Time A fundamental lower tax rates. In essence, the Laffer Curve shown in
criticism relates to the degree to which economic incen- Figure 15.10 shifted rightward, increasing net tax reve-
tives are sensitive to changes in tax rates. Skeptics say ample nues. But the tax-rate cuts did not produce extraordinary
empirical evidence shows that the impact of a tax cut on rightward shifts of the long-run aggregate supply curve.
incentives is small, of uncertain direction, and relatively Indeed, saving fell as a percentage of personal income dur-
slow to emerge. For example, with respect to work incen- ing the period, productivity growth was sluggish, and real
tives, studies indicate that decreases in tax rates lead some GDP growth was not extraordinarily strong.
mcc26632_ch15_284-301.indd 297 9/1/06 3:17:12 PM
9/1/06 3:17:12 PM
mcc26632_ch15_284-301.indd 297