
Page 342 - Economics
P. 342
CONFIRMING PAGES
PART FIVE
294
Long-Run Perspectives and Macroeconomic Debates
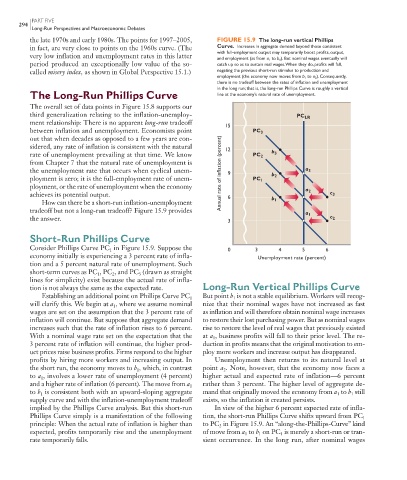
the late 1970s and early 1980s. The points for 1997–2005, FIGURE 15.9 The long-run vertical Phillips
in fact, are very close to points on the 1960s curve. (The Curve. Increases in aggregate demand beyond those consistent
with full-employment output may temporarily boost profits, output,
very low inflation and unemployment rates in this latter
and employment (as from a 1 to b 1 ). But nominal wages eventually will
period produced an exceptionally low value of the so- catch up so as to sustain real wages. When they do, profits will fall,
called misery index, as shown in Global Perspective 15.1.) negating the previous short-run stimulus to production and
employment (the economy now moves from b 1 to a 2 ). Consequently,
there is no tradeoff between the rates of inflation and unemployment
in the long run; that is, the long-run Phillips Curve is roughly a vertical
The Long-Run Phillips Curve line at the economy’s natural rate of unemployment.
The overall set of data points in Figure 15.8 supports our
third generalization relating to the inflation-unemploy- PC LR
ment relationship: There is no apparent long-run tradeoff 15
between inflation and unemployment. Economists point PC 3
out that when decades as opposed to a few years are con-
sidered, any rate of inflation is consistent with the natural 12
rate of unemployment prevailing at that time. We know PC 2 b 3
from Chapter 7 that the natural rate of unemployment is
the unemployment rate that occurs when cyclical unem- Annual rate of inflation (percent) 9 a 3
ployment is zero; it is the full-employment rate of unem- PC 1 b 2
ployment, or the rate of unemployment when the economy
achieves its potential output. 6 a 2 c 3
How can there be a short-run inflation-unemployment b 1
tradeoff but not a long-run tradeoff? Figure 15.9 provides
a 1
the answer. 3 c 2
Short-Run Phillips Curve
Consider Phillips Curve PC in Figure 15.9 . Suppose the 0 3 4 5 6
1
economy initially is experiencing a 3 percent rate of infla- Unemployment rate (percent)
tion and a 5 percent natural rate of unemployment. Such
short-term curves as PC , PC , and PC (drawn as straight
3
2
1
lines for simplicity) exist because the actual rate of infla-
tion is not always the same as the expected rate. Long-Run Vertical Phillips Curve
Establishing an additional point on Phillips Curve PC But point b is not a stable equilibrium. Workers will recog-
1
1
will clarify this. We begin at a , where we assume nominal nize that their nominal wages have not increased as fast
1
wages are set on the assumption that the 3 percent rate of as inflation and will therefore obtain nominal wage increases
inflation will continue. But suppose that aggregate demand to restore their lost purchasing power. But as nominal wages
increases such that the rate of inflation rises to 6 percent. rise to restore the level of real wages that previously existed
With a nominal wage rate set on the expectation that the at a , business profits will fall to their prior level. The re-
1
3 percent rate of inflation will continue, the higher prod- duction in profits means that the original motivation to em-
uct prices raise business profits. Firms respond to the higher ploy more workers and increase output has disappeared.
profits by hiring more workers and increasing output. In Unemployment then returns to its natural level at
the short run, the economy moves to b , which, in contrast point a . Note, however, that the economy now faces a
1
2
to a , involves a lower rate of unemployment (4 percent) higher actual and expected rate of inflation—6 percent
1
and a higher rate of inflation (6 percent). The move from a rather than 3 percent. The higher level of aggregate de-
1
to b is consistent both with an upward-sloping aggregate mand that originally moved the economy from a to b still
1
1
1
supply curve and with the inflation-unemployment tradeoff exists, so the inflation it created persists.
implied by the Phillips Curve analysis. But this short-run In view of the higher 6 percent expected rate of infla-
Phillips Curve simply is a manifestation of the following tion, the short-run Phillips Curve shifts upward from PC 1
principle: When the actual rate of inflation is higher than to PC 2 in Figure 15.9 . An “along-the-Phillips-Curve” kind
expected, profits temporarily rise and the unemployment of move from a to b on PC is merely a short-run or tran-
1
1
1
rate temporarily falls. sient occurrence. In the long run, after nominal wages
9/1/06 3:17:11 PM
mcc26632_ch15_284-301.indd 294
mcc26632_ch15_284-301.indd 294 9/1/06 3:17:11 PM