
Page 340 - Economics
P. 340
CONFIRMING PAGES
PART FIVE
292
Long-Run Perspectives and Macroeconomic Debates
Figure 15.6 b reveals that the facts for the 1960s nicely unemployment rate. As the unemployment rate falls and
fit the theory. On the basis of that evidence and evidence dips below the natural rate, the excessive spending produces
from other countries, most economists concluded there demand-pull inflation. Conversely, when recession sets in
was a stable, predictable tradeoff between unemployment and the unemployment rate increases, the weak aggregate
and inflation. Moreover, U.S. economic policy was built on demand that caused the recession also leads to lower infla-
that supposed tradeoff. According to this thinking, it was tion rates.
impossible to achieve “full employment without inflation”: Periods of exceptionally low unemployment rates and
Manipulation of aggregate demand through fiscal and inflation rates do occur, but only under special sets of
monetary measures would simply move the economy along economic circumstances. One such period was the late
the Phillips Curve. An expansionary fiscal and monetary 1990s, when faster productivity growth increased aggre-
policy that boosted aggregate demand and lowered the un- gate supply and fully blunted the inflationary impact of
employment rate would simultaneously increase inflation. rapidly rising aggregate demand (review Figure 10.10).
A restrictive fiscal and monetary policy could be used to
reduce the rate of inflation but only at the cost of a higher
unemployment rate and more forgone production. Society Aggregate Supply Shocks and the
had to choose between the incompatible goals of price sta- Phillips Curve
bility and full employment; it had to decide where to locate The unemployment-inflation experience of the 1970s and
on its Phillips Curve. early 1980s demolished the idea of an always-stable
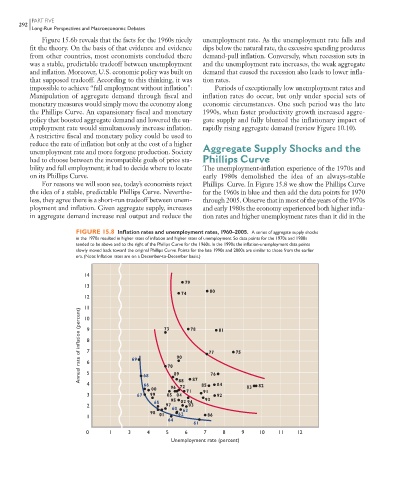
For reasons we will soon see, today’s economists reject Phillips Curve. In Figure 15.8 we show the Phillips Curve
the idea of a stable, predictable Phillips Curve. Neverthe- for the 1960s in blue and then add the data points for 1970
less, they agree there is a short-run tradeoff between unem- through 2005. Observe that in most of the years of the 1970s
ployment and inflation. Given aggregate supply, increases and early 1980s the economy experienced both higher infla-
in aggregate demand increase real output and reduce the tion rates and higher unemployment rates than it did in the
FIGURE 15.8 Inflation rates and unemployment rates, 1960–2005. A series of aggregate supply shocks
in the 1970s resulted in higher rates of inflation and higher rates of unemployment. So data points for the 1970s and 1980s
tended to be above and to the right of the Phillips Curve for the 1960s. In the 1990s the inflation-unemployment data points
slowly moved back toward the original Phillips Curve. Points for the late 1990s and 2000s are similar to those from the earlier
era. (Note: Inflation rates are on a December-to-December basis.)
14
79
13
80
74
12
11
Annual rate of inflation (percent) 9 8 7 6 69 73 90 78 77 81 75
10
4 5 68 70 89 88 87 85 76 84 82
66
72
00 96 71 91 83
3 67 99 05 04 92
95 93
65 02 94
2 97 03
60
98 63
1 01 62 86
64
61
0 1 3 4 5 6 7 8 9 10 11 12
Unemployment rate (percent)
9/1/06 3:17:10 PM
mcc26632_ch15_284-301.indd 292 9/1/06 3:17:10 PM
mcc26632_ch15_284-301.indd 292