
Page 563 - Economics
P. 563
CONFIRMING PAGES
CHAPTER 25
495
The Demand for Resources
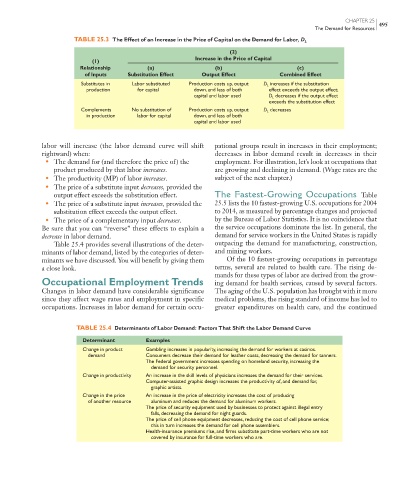
TABLE 25.3 The Effect of an Increase in the Price of Capital on the Demand for Labor, D L
(2)
Increase in the Price of Capital
(1)
Relationship (a) (b) (c)
of Inputs Substitution Effect Output Effect Combined Effect
Substitutes in Labor substituted Production costs up, output D L increases if the substitution
production for capital down, and less of both effect exceeds the output effect;
capital and labor used D L decreases if the output effect
exceeds the substitution effect
Complements No substitution of Production costs up, output D L decreases
in production labor for capital down, and less of both
capital and labor used
labor will increase (the labor demand curve will shift pational groups result in increases in their employment;
rightward) when: decreases in labor demand result in decreases in their
• The demand for (and therefore the price of) the employment. For illustration, let’s look at occupations that
product produced by that labor increases . are growing and declining in demand. (Wage rates are the
• The productivity (MP) of labor increases . subject of the next chapter.)
• The price of a substitute input decreases, provided the
output effect exceeds the substitution effect. The Fastest-Growing Occupations Table
• The price of a substitute input increases, provided the 25.5 lists the 10 fastest-growing U.S. occupations for 2004
substitution effect exceeds the output effect. to 2014, as measured by percentage changes and projected
• The price of a complementary input decreases . by the Bureau of Labor Statistics. It is no coincidence that
Be sure that you can “reverse” these effects to explain a the service occupations dominate the list. In general, the
decrease in labor demand. demand for service workers in the United States is rapidly
Table 25.4 provides several illustrations of the deter- outpacing the demand for manufacturing, construction,
minants of labor demand, listed by the categories of deter- and mining workers.
minants we have discussed. You will benefit by giving them Of the 10 fastest-growing occupations in percentage
a close look. terms, several are related to health care. The rising de-
mands for these types of labor are derived from the grow-
Occupational Employment Trends ing demand for health services, caused by several factors.
Changes in labor demand have considerable significance The aging of the U.S. population has brought with it more
since they affect wage rates and employment in specific medical problems, the rising standard of income has led to
occupations. Increases in labor demand for certain occu- greater expenditures on health care, and the continued
TABLE 25.4 Determinants of Labor Demand: Factors That Shift the Labor Demand Curve
Determinant Examples
Change in product Gambling increases in popularity, increasing the demand for workers at casinos.
demand Consumers decrease their demand for leather coats, decreasing the demand for tanners.
The Federal government increases spending on homeland security, increasing the
demand for security personnel.
Change in productivity An increase in the skill levels of physicians increases the demand for their services.
Computer-assisted graphic design increases the productivity of, and demand for,
graphic artists.
Change in the price An increase in the price of electricity increases the cost of producing
of another resource aluminum and reduces the demand for aluminum workers.
The price of security equipment used by businesses to protect against illegal entry
falls, decreasing the demand for night guards.
The price of cell phone equipment decreases, reducing the cost of cell phone service;
this in turn increases the demand for cell phone assemblers.
Health-insurance premiums rise, and firms substitute part-time workers who are not
covered by insurance for full-time workers who are.
mcc26632_ch25_487-504.indd 495 9/8/06 1:09:47 PM
9/8/06 1:09:47 PM
mcc26632_ch25_487-504.indd 495