
Page 560 - Economics
P. 560
CONFIRMING PAGES
PART SEVEN
492
Microeconomics of Resource Markets
TABLE 25.2 The Demand for Labor: Imperfect Competition in the Sale of the Product
(1) (2) (3) (4) (5) (6)
Units of Total Product Marginal Product Total Revenue, Marginal Revenue
Resource (Output) Product (MP) Price (2) (4) Product (MRP)
0 0 $2.80 $ 0
]——————–––—–7 ]—————–––—– $18.20
1 7 2.60 18.20
]——————–––—–6 ]————–––––—– 13.00
2 13 2.40 31.20
]——————–––—–5 ]————–––––—– 8.40
3 18 2.20 39.60
]——————–––—–4 ]————–––––—– 4.40
4 22 2.00 44.00
]——————–––—–3 ]———––—–––—– 2.25
5 25 1.85 46.25
]——————–––—–2 ]————–––––—– 1.00
6 27 1.75 47.25
]——————–––—–1 ]————–––––—– 1.05
7 28 1.65 46.20
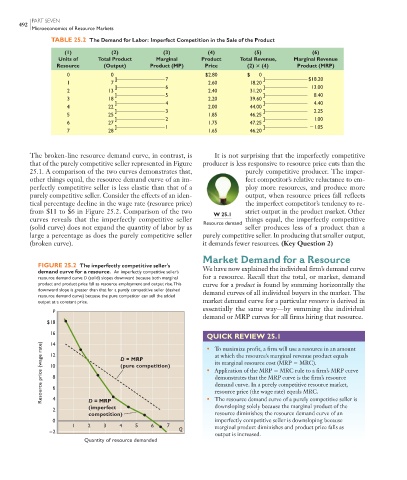
The broken-line resource demand curve, in contrast, is It is not surprising that the imperfectly competitive
that of the purely competitive seller represented in Figure producer is less responsive to resource price cuts than the
25.1 . A comparison of the two curves demonstrates that, purely competitive producer. The imper-
other things equal, the resource demand curve of an im- fect competitor’s relative reluctance to em-
perfectly competitive seller is less elastic than that of a ploy more resources, and produce more
purely competitive seller. Consider the effects of an iden- output, when resource prices fall reflects
tical percentage decline in the wage rate (resource price) the imperfect competitor’s tendency to re-
from $11 to $6 in Figure 25.2 . Comparison of the two strict output in the product market. Other
W 25.1
curves reveals that the imperfectly competitive seller things equal, the imperfectly competitive
Resource demand
(solid curve) does not expand the quantity of labor by as seller produces less of a product than a
large a percentage as does the purely competitive seller purely competitive seller. In producing that smaller output,
(broken curve). it demands fewer resources. (Key Question 2)
Market Demand for a Resource
FIGURE 25.2 The imperfectly competitive seller’s
demand curve for a resource. An imperfectly competitive seller’s We have now explained the individual firm’s demand curve
resource demand curve D (solid) slopes downward because both marginal for a resource. Recall that the total, or market, demand
product and product price fall as resource employment and output rise. This curve for a product is found by summing horizontally the
downward slope is greater than that for a purely competitive seller (dashed
resource demand curve) because the pure competitor can sell the added demand curves of all individual buyers in the market. The
output at a constant price. market demand curve for a particular resource is derived in
P essentially the same way—by summing the individual
demand or MRP curves for all firms hiring that resource.
$18
16
QUICK REVIEW 25.1
Resource price (wage rate) 12 8 6 D = MRP • Application of the MRP MRC rule to a firm’s MRP curve
14
• To maximize profit, a firm will use a resource in an amount
at which the resource’s marginal revenue product equals
its marginal resource cost (MRP MRC).
(pure competition)
10
demonstrates that the MRP curve is the firm’s resource
demand curve. In a purely competitive resource market,
resource price (the wage rate) equals MRC.
downsloping solely because the marginal product of the
(imperfect
2 4 D = MRP • The resource demand curve of a purely competitive seller is
competition) resource diminishes; the resource demand curve of an
0 imperfectly competitive seller is downsloping because
1 2 3 4 5 6 7 marginal product diminishes and product price falls as
–2 Q
output is increased.
Quantity of resource demanded
9/8/06 1:09:46 PM
mcc26632_ch25_487-504.indd 492 9/8/06 1:09:46 PM
mcc26632_ch25_487-504.indd 492