
Page 209 - Environment: The Science Behind the Stories
P. 209
farm labor in rural areas, and care for aging parents. Daughters,
in contrast, will most likely marry and leave their parents, as
the culture dictates. As a result, they cannot provide the same
benefits to their parents as will sons. Thus, faced with being
limited to just one child, many Chinese couples prefer a son to
a daughter. Tragically, this has led to selective abortion, killing
of female infants, an unbalanced sex ratio, and a black-market
trade in teenaged girls for young men who cannot find wives.
Further problems are expected in the near future, including
an aging population and a shrinking workforce. Moreover, Chi-
na’s policies have elicited criticism worldwide from people who
oppose government intrusion into personal reproductive choices.
As other nations become more and more crowded,
might their governments also feel forced to turn to drastic
policies that restrict individual freedoms? In this chapter, we
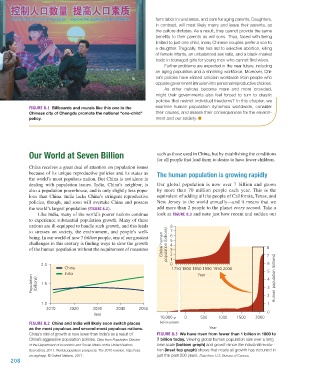
Figure 8.1 Billboards and murals like this one in the examine human population dynamics worldwide, consider
Chinese city of Chengdu promote the national “one-child” their causes, and assess their consequences for the environ-
policy. ment and our society.
Our World at Seven Billion such as those used in China, but by establishing the conditions
for all people that lead them to desire to have fewer children.
China receives a great deal of attention on population issues
because of its unique reproductive policies and its status as The human population is growing rapidly
the world’s most populous nation. But China is not alone in
dealing with population issues. India, China’s neighbor, is Our global population is now over 7 billion and grows
also a population powerhouse, and is only slightly less popu- by more than 70 million people each year. This is the
lous than China. India lacks China’s stringent reproductive equivalent of adding all the people of California, Texas, and
policies, though, and soon will overtake China and possess New Jersey to the world annually—and it means that we
the world’s largest population (Figure 8.2). add more than 2 people to the planet every second. Take a
Like India, many of the world’s poorer nations continue look at Figure 8.3 and note just how recent and sudden our
to experience substantial population growth. Many of these
nations are ill-equipped to handle such growth, and this leads 8
to stresses on society, the environment, and people’s well- 7
being. In our world of now 7 billion people, one of our greatest 6
5
challenges in this century is finding ways to slow the growth Global human population (billions) 4
of the human population without the requirement of measures 3 8 7
2
0
2.0 1 6
China 1750 1800 1850 1900 1950 2000
India Year 5 Human population (billions)
Population (billions) 1.5 4 3
2
1.0 1
2010 2020 2030 2040 2050
Year 0
10,000 yr 0 500 1000 1500 2000
Figure 8.2 China and India will likely soon switch places before present
as the most populous and second-most populous nations. Year
China’s rate of growth is now lower than India’s as a result of Figure 8.3 We have risen from fewer than 1 billion in 1800 to
China’s aggressive population policies. Data from Population Division 7 billion today. Viewing global human population size over a long
of the Department of Economic and Social Affairs of the United Nations time scale (bottom graph) and growth since the industrial revolu-
Secretariat, 2011. World population prospects: The 2010 revision, http://esa. tion (inset top graph) shows that nearly all growth has occurred in
un.org/wpp. © United Nations, 2011. just the past 200 years. Data from U.S. Bureau of Census.
208
M08_WITH7428_05_SE_C08.indd 208 12/12/14 2:58 PM