
Page 214 - Environment: The Science Behind the Stories
P. 214
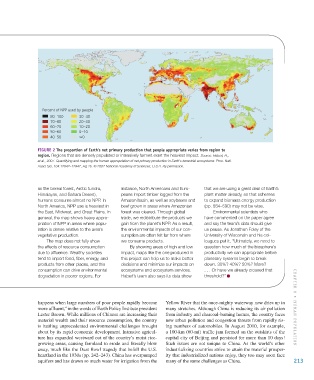
Percent of NPP used by people
                              80–100     30–40
                              70–80      20–30
                              60–70      10–20
                              50–60      0–10
                              40–50      ≤0

                        Figure 2 The proportion of earth’s net primary production that people appropriate varies from region to
                        region. Regions that are densely populated or intensively farmed exert the heaviest impact. Source: Haberl, H.,
                        et al., 2007. Quantifying and mapping the human appropriation of net primary production in Earth’s terrestrial ecosystems. Proc. Natl.
                        Acad. Sci. 104:12942–12947, Fig 1b. © 2007 National Academy of Sciences, U.S.A. By permission.


                        as the boreal forest, Arctic tundra,   instance, North Americans and Euro-  that we are using a great deal of Earth’s
                        Himalayas, and Sahara Desert),     peans import timber logged from the   plant matter already, so that schemes
                        humans consume almost no NPP. In   Amazon basin, as well as soybeans and   to expand biomass energy production
                        North America, NPP use is heaviest in   beef grown in areas where Amazonian   (pp. 584–590) may not be wise.
                        the East, Midwest, and Great Plains. In   forest was cleared. Through global   Environmental scientists who
                        general, the map shows heavy appro-  trade, we redistribute the products we   have commented on the paper agree
                        priation of NPP in areas where popu-  gain from the planet’s NPP. As a result,   and say the team’s data should give
                        lation is dense relative to the area’s   the environmental impacts of our con-  us pause. As Jonathan Foley of the
                        vegetative production.             sumption are often felt far from where   University of Wisconsin and his col-
                            The map does not fully show    we consume products.              leagues put it, “Ultimately, we need to
                        the effects of resource consumption   By showing areas of high and low   question how much of the biosphere’s
                        due to affluence. Wealthy societies   impact, maps like the one produced in   productivity we can appropriate before
                        tend to import food, fiber, energy, and   this project can help us to make better   planetary systems begin to break
                        products from other places, and this   decisions and minimize our impacts on   down. 30%? 40%? 50%? More?
                        consumption can drive environmental   ecosystems and ecosystem services.   . . . Or have we already crossed that
                        degradation in poorer regions. For   Haberl’s team also says its data show   threshold?”


                        happens when large numbers of poor people rapidly become   Yellow River that the once-mighty waterway now dries up in
                        more affluent,” in the words of Earth Policy Institute president   many stretches. Although China is reducing its air pollution   CHAPTER 8 •  Hum A n Po P ul AT i on
                        Lester Brown. While millions of Chinese are increasing their   from industry and charcoal-burning homes, the country faces
                        material wealth and their resource consumption, the country   new urban pollution and congestion threats from rapidly ris-
                        is battling unprecedented environmental challenges brought   ing numbers of automobiles. In August 2010, for example,
                        about by its rapid economic development. Intensive agricul-  a 100-km (60-mi) traffic jam formed on the outskirts of the
                        ture has expanded westward out of the country’s moist rice-  capital city of Beijing and persisted for more than 10 days!
                        growing areas, causing farmland to erode and literally blow   Such issues are not unique to China. As the world’s other
                        away, much like the Dust Bowl tragedy that befell the U.S.   industrializing countries strive to attain the material prosper-
                        heartland in the 1930s (pp. 242–243). China has overpumped   ity that industrialized nations enjoy, they too may soon face
                        aquifers and has drawn so much water for irrigation from the   many of the same challenges as China.      213


           M08_WITH7428_05_SE_C08.indd   213                                                                                    12/12/14   2:58 PM