
Page 219 - Environment: The Science Behind the Stories
P. 219
engage in more risky sexual activity than their married coun-
terparts. Researchers speculate that this could lead to higher inci-
dence of HIV in China in coming decades, as tens of millions
of bachelors adopt such a lifestyle.
China’s skewed sex ratios have also resulted in a grim
new phenomenon. In parts of rural China, teenaged girls are
being kidnapped and sold to families in other parts of the
country as brides for single men.
WEIGHING THE ISSUES
CHINa’S REPROdUCTIvE POLICy Consider the benefits as
well as the problems associated with a reproductive policy
such as China’s. Do you think a government should be able
to enforce strict penalties for citizens who fail to abide by such
a policy? If you disagree with China’s policy, what alternatives
can you suggest for dealing with the resource demands of a
rapidly growing population?
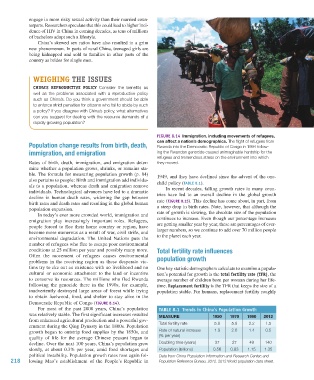
Figure 8.14 Immigration, including movements of refugees,
can affect a nation’s demographics. The flight of refugees from
Population change results from birth, death, Rwanda into the Democratic Republic of Congo in 1994 follow-
immigration, and emigration ing the Rwandan genocide caused unimaginable hardship for the
refugees and tremendous stress on the environment into which
Rates of birth, death, immigration, and emigration deter- they moved.
mine whether a population grows, shrinks, or remains sta-
ble. The formula for measuring population growth (p. 84) 1949, and they have declined since the advent of the one-
also pertains to people: Birth and immigration add individu- child policy (TAbLe 8.1).
als to a population, whereas death and emigration remove In recent decades, falling growth rates in many coun-
individuals. Technological advances have led to a dramatic tries have led to an overall decline in the global growth
decline in human death rates, widening the gap between
birth rates and death rates and resulting in the global human rate (Figure 8.15). This decline has come about, in part, from
population expansion. a steep drop in birth rates. Note, however, that although the
In today’s ever more crowded world, immigration and rate of growth is slowing, the absolute size of the population
emigration play increasingly important roles. Refugees, continues to increase. Even though our percentage increases
people forced to flee their home country or region, have are getting smaller year by year, these are percentages of ever-
become more numerous as a result of war, civil strife, and larger numbers, so we continue to add over 70 million people
environmental degradation. The United Nations puts the to the planet each year.
number of refugees who flee to escape poor environmental
conditions at 25 million per year and possibly many more. Total fertility rate influences
Often the movement of refugees causes environmental population growth
problems in the receiving region as these desperate vic-
tims try to eke out an existence with no livelihood and no One key statistic demographers calculate to examine a popula-
cultural or economic attachment to the land or incentive tion’s potential for growth is the total fertility rate (TFR), the
to conserve its resources. The millions who fled Rwanda average number of children born per woman during her life-
following the genocide there in the 1990s, for example, time. Replacement fertility is the TFR that keeps the size of a
inadvertently destroyed large areas of forest while trying population stable. For humans, replacement fertility roughly
to obtain fuelwood, food, and shelter to stay alive in the
Democratic Republic of Congo (Figure 8.14).
For most of the past 2000 years, China’s population TAbLe 8.1 Trends in china’s Population growth
was relatively stable. The first significant increases resulted MEAsUrE 1950 1970 1990 2012
from enhanced agricultural production and a powerful gov-
ernment during the Qing Dynasty in the 1800s. Population Total fertility rate 5.8 5.8 2.2 1.5
growth began to outstrip food supplies by the 1850s, and Rate of natural increase 1.9 2.6 1.4 0.5
quality of life for the average Chinese peasant began to (% per year)
decline. Over the next 100 years, China’s population grew Doubling time (years) 37 27 49 140
slowly, at about 0.3% per year, amid food shortages and Population (billions) 0.56 0.83 1.15 1.35
political instability. Population growth rates rose again fol- Data from China Population Information and Research Center; and
218 lowing Mao’s establishment of the People’s Republic in Population Reference Bureau, 2012. 2012 World population data sheet.
M08_WITH7428_05_SE_C08.indd 218 12/12/14 2:58 PM