
Page 220 - Environment: The Science Behind the Stories
P. 220
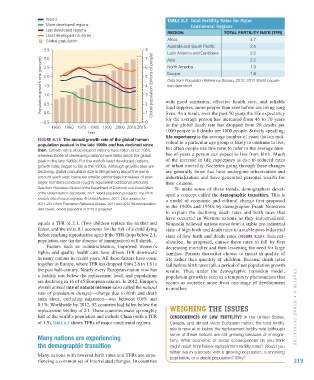
World                                             TAbLe 8.2   Total Fertility rates for Major
                            More developed regions                                      continental regions
                            Less developed regions                            rEgIoN                 ToTAl fErTIlITy rATE (Tfr)
                            Least developed countries
                            Global population                                 Africa                            4.7
                                                                              Australia and South Pacific       2.5
                           3.5                                       8        Latin America and Caribbean       2.2
                                                                     7
                           3.0
                          Population growth rate (percent)  2.0      5  Global population (billions of people)  with  good  sanitation,  effective  health  care,  and  reliable
                                                                              Asia
                                                                                                                2.2
                                                                              North America
                                                                                                                1.9
                                                                     6
                           2.5
                                                                              Europe
                                                                                                                1.6
                                                                              Data from Population Reference Bureau, 2012. 2012 World popula-
                                                                              tion data sheet.
                                                                     4
                           1.5
                                                                     3
                           1.0
                                                                     2
                           0.5
                           0.0
                                                                             lives. As a result, over the past 50 years the life expectancy
                                                                             for the average person has increased from 46 to 70 years
                          –0.5                                       1       food supplies, more people than ever before are living long
                                                                     0
                                                                             as the global death rate has dropped from 20 deaths per
                              1950 1960 1970 1980 1990 2000 2010 2015
                                             Year                            1000 people to 8 deaths per 1000 people. Strictly speaking,
                                                                             life expectancy is the average number of years that an indi-
                        Figure 8.15  The annual growth rate of the global human
                        population peaked in the late 1960s and has declined since   vidual in a particular age group is likely to continue to live,
                        then. Growth rates of developed nations have fallen since 1950,   but often people use this term to refer to the average num-
                        whereas those of developing nations have fallen since the global   ber of years a person can expect to live from birth. Much
                        peak in the late 1960s. For the world’s least developed nations,   of the increase in life expectancy is due to reduced rates
                        growth rates began to fall in the 1990s. Although growth rates are   of infant mortality. Societies going through these changes
                        declining, global population size is still growing about the same   are generally those that have undergone urbanization and
                        amount each year, because smaller percentage increases of ever-  industrialization and have generated personal wealth for
                        larger numbers produce roughly equivalent additional amounts.   their citizens.
                        Data from Population Division of the Department of Economic and Social Affairs   To  make  sense  of  these  trends,  demographers  devel-
                        of the United Nations Secretariat, 2011. World population prospects: The 2010   oped a concept called the demographic transition. This is
                        revision. http://esa.un.org/wpp. © United Nations, 2011. Data updates for   a model of economic and cultural change first proposed
                        2011–2012 from Population Reference Bureau, 2011 and 2012 World population   in the 1940s and 1950s by demographer Frank Notestein
                        data sheets. Global population in 2015 is projected.
                                                                             to explain the declining death rates and birth rates that
                                                                             have occurred in  Western nations  as they industrialized.
                        equals a TFR of 2.1. (Two children replace the mother and   Notestein believed nations move from a stable pre-industrial
                        father, and the extra 0.1 accounts for the risk of a child dying   state of high birth and death rates to a stable post-industrial
                        before reaching reproductive age.) If the TFR drops below 2.1,   state of low birth and death rates (Figure 8.16). Industri-
                        population size (in the absence of immigration) will shrink.  alization, he proposed, causes these rates to fall by first
                            Factors such as industrialization, improved women’s   decreasing mortality and then lessening the need for large
                        rights, and quality health care have driven  TFR downward   families. Parents thereafter choose to invest in quality of
                        in many nations in recent years. All these factors have come   life rather than quantity of children. Because death rates
                        together in Europe, where TFR has dropped from 2.6 to 1.6 in   fall before birth rates fall, a period of net population growth
                        the past half-century. Nearly every European nation now has   results.  Thus, under  the  demographic transition  model,
                        a fertility rate below the replacement level, and populations   population growth is seen as a temporary phenomenon that
                        are declining in 16 of 45 European nations. In 2012, Europe’s   occurs as societies move from one stage of development
                        overall annual rate of natural increase (also called the natural   to another.
                        rate of population change)—change due to birth and death
                        rates alone, excluding migration—was between 0.0% and
                        0.1%. Worldwide by 2012, 92 countries had fallen below the
                        replacement fertility of 2.1. These countries make up roughly   WEIGHING THE ISSUES                       CHAPTER 8 •  Hum A n Po P ul AT i on
                        half of the world’s population and include China (with a TFR   CONSEQUENCES  OF LOW FERTILITy?  In the United States,
                        of 1.5). TAbLe 8.2 shows TFRs of major continental regions.  Canada, and almost every European nation, the total fertility
                                                                               rate is now at or below the replacement fertility rate (although
                        Many nations are experiencing                          some of these nations are still growing because of immigra-
                                                                               tion).  What  economic  or  social  consequences  do  you  think
                        the demographic transition                             might result from below-replacement fertility rates? Would you
                                                                               rather live in a society with a growing population, a shrinking
                        Many nations with lowered birth rates and TFRs are expe-  population, or a stable population? Why?
                        riencing a common set of interrelated changes. In countries                                               219


           M08_WITH7428_05_SE_C08.indd   219                                                                                    12/12/14   2:58 PM