
Page 215 - Environment: The Science Behind the Stories
P. 215
Demography
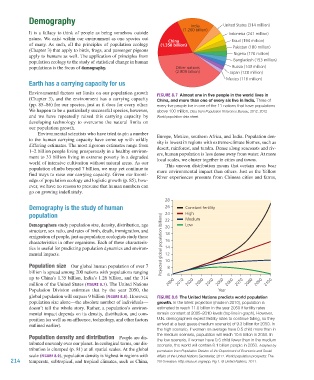
India United States (314 million)
(1.260 billion)
It is a fallacy to think of people as being somehow outside Indonesia (241 million)
nature. We exist within our environment as one species out China Brazil (194 million)
of many. As such, all the principles of population ecology (1.350 billion) Pakistan (180 million)
(Chapter 3) that apply to birds, frogs, and passenger pigeons
apply to humans as well. The application of principles from Nigeria (170 million)
population ecology to the study of statistical change in human Bangladesh (153 million)
populations is the focus of demography. Other nations Russia (143 million)
(2.809 billion) Japan (128 million)
Mexico (116 million)
Earth has a carrying capacity for us
Environmental factors set limits on our population growth Figure 8.7 Almost one in five people in the world lives in
(Chapter 3), and the environment has a carrying capacity China, and more than one of every six live in India. Three of
(pp. 85–86) for our species, just as it does for every other. every five people live in one of the 11 nations that have populations
We happen to be a particularly successful species, however, above 100 million. Data from Population Reference Bureau, 2012. 2012
and we have repeatedly raised this carrying capacity by World population data sheet.
developing technology to overcome the natural limits on
our population growth.
Environmental scientists who have tried to pin a number Europe, Mexico, southern Africa, and India. Population den-
to the human carrying capacity have come up with wildly sity is lowest in regions with extreme-climate biomes, such as
differing estimates. The most rigorous estimates range from desert, rainforest, and tundra. Dense along seacoasts and riv-
1–2 billion people living prosperously in a healthy environ- ers, human population is less dense away from water. At more
ment to 33 billion living in extreme poverty in a degraded local scales, we cluster together in cities and towns.
world of intensive cultivation without natural areas. As our This uneven distribution means that certain areas bear
population climbs beyond 7 billion, we may yet continue to more environmental impact than others. Just as the Yellow
find ways to raise our carrying capacity. Given our knowl- River experiences pressure from Chinese cities and farms,
edge of population ecology and logistic growth (p. 85), how-
ever, we have no reason to presume that human numbers can
go on growing indefinitely.
28
Demography is the study of human 26 Constant fertility
population 24 High
Medium
demographers study population size, density, distribution, age 22 Low
20
structure, sex ratio, and rates of birth, death, immigration, and 18
emigration of people, just as population ecologists study these
characteristics in other organisms. Each of these characteris- Projected global population (billions) 16
tics is useful for predicting population dynamics and environ- 14
mental impacts. 12
Population size Our global human population of over 7 10 8
billion is spread among 200 nations with populations ranging 6
up to China’s 1.35 billion, India’s 1.26 billion, and the 314
million of the United States (Figure 8.7). The United Nations 2000 2010 2020 2030 2040 2050 2060 2070 2080 2090 2100
Population Division estimates that by the year 2050, the Year
global population will surpass 9 billion (Figure 8.8). However, Figure 8.8 The United Nations predicts world population
population size alone—the absolute number of individuals— growth. In the latest projection (made in 2010), population is
doesn’t tell the whole story. Rather, a population’s environ- estimated to reach 11.0 billion in the year 2050 if fertility rates
mental impact depends on its density, distribution, and com- remain constant at 2005–2010 levels (top line in graph). However,
position (as well as on affluence, technology, and other factors U.N. demographers expect fertility rates to continue falling, so they
outlined earlier). arrived at a best guess (medium scenario) of 9.3 billion for 2050. In
the high scenario, if women on average have 0.5 child more than in
the medium scenario, population will reach 10.6 billion in 2050. In
Population density and distribution People are dis- the low scenario, if women have 0.5 child fewer than in the medium
tributed unevenly over our planet. In ecological terms, our dis- scenario, the world will contain 8.1 billion people in 2050. Adapted by
tribution is clumped (p. 81) at all spatial scales. At the global permission from Population Division of the Department of Economic and Social
scale (Figure 8.9), population density is highest in regions with Affairs of the United Nations Secretariat, 2011. World population prospects: The
214 temperate, subtropical, and tropical climates, such as China, 2010 revision. http://esa.un.org/wpp, Fig 1. © United Nations, 2011.
M08_WITH7428_05_SE_C08.indd 214 12/12/14 2:58 PM