
Page 216 - Environment: The Science Behind the Stories
P. 216
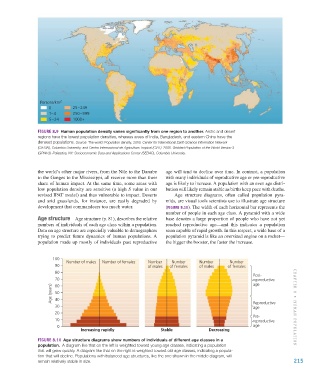
Persons/km 2
                             0         25–249
                             1–4       250–999
                             5–24      1000+

                        Figure 8.9  Human population density varies significantly from one region to another. Arctic and desert
                        regions have the lowest population densities, whereas areas of India, Bangladesh, and eastern China have the
                        densest populations. Source: The world: Population density, 2000. Center for International Earth Science Information Network
                        (CIESIN), Columbia University; and Centro Internacional de Agricultura Tropical (CIAT). 2005. Gridded Population of the World Version 3
                        (GPWv3). Palisades, NY: Socioeconomic Data and Applications Center (SEDAC), Columbia University.


                        the world’s other major rivers, from the Nile to the Danube   age will tend to decline over time. In contrast, a population
                        to the Ganges to the Mississippi, all receive more than their   with many individuals of reproductive age or pre-reproductive
                        share of human impact. At the same time, some areas with   age is likely to increase. A population with an even age distri-
                        low population density are sensitive (a high S value in our   bution will likely remain stable as births keep pace with deaths.
                        revised IPAT model) and thus vulnerable to impact. Deserts   Age structure diagrams, often called population pyra-
                        and arid grasslands, for instance, are easily degraded by   mids, are visual tools scientists use to illustrate age structure
                        development that commandeers too much water.         (Figure 8.10). The width of each horizontal bar represents the
                                                                             number of people in each age class. A pyramid with a wide
                        Age structure  Age structure (p. 81), describes the relative   base denotes a large proportion of people who have not yet
                        numbers of individuals of each age class within a population.   reached reproductive age—and this indicates a population
                        Data on age structure are especially valuable to demographers   soon capable of rapid growth. In this respect, a wide base of a
                        trying to predict future dynamics of human populations. A   population pyramid is like an oversized engine on a rocket—
                        population made up mostly of individuals past reproductive   the bigger the booster, the faster the increase.


                               100
                                    Number of males  Number of females  Number  Number     Number       Number
                               90                                     of males  of females  of males   of females
                               80
                                                                                                                 Post-
                               70                                                                                reproductive
                                                                                                                 age
                               60
                              Age (years)  50
                               40
                               30                                                                                Reproductive     CHAPTER 8 •  Hum A n Po P ul AT i on
                                                                                                                 age
                               20
                                                                                                                 Pre-
                               10                                                                                reproductive
                                0                                                                                age
                                          Increasing rapidly               Stable              Decreasing

                        Figure 8.10  Age structure diagrams show numbers of individuals of different age classes in a
                        population.  A diagram like that on the left is weighted toward young age classes, indicating a population
                        that will grow quickly. A diagram like that on the right is weighted toward old age classes, indicating a popula-
                        tion that will decline. Populations with balanced age structures, like the one shown in the middle diagram, will
                        remain relatively stable in size.                                                                         215


           M08_WITH7428_05_SE_C08.indd   215                                                                                    12/12/14   2:58 PM