
Page 213 - Environment: The Science Behind the Stories
P. 213
THE SCIENCE BEHINd THE STORy
Mapping Our Haberl’s group layered the data sets
Population’s atop one another in a geographic
information systems (GIS) approach
Environmental (pp. 132–133). Again, they calculated the
Impact proportion of NPP that we appropriate
and produced a global map (Figure 2).
Burgeoning numbers of people are The researchers published their results in
making heavy demands on Earth’s 2007 in the Proceedings of the National
natural resources and ecosystem ser- Academy of Sciences of the USA.
vices. How can we quantify and map In their global map of NPP
the environmental impacts our expand- consumption, densely populated and
ing population is exerting? dr. helmut haberl of Austria’s heavily farmed regions such as India,
One way is to ask. Of all the bio- institute for Social ecology eastern China, and Europe show the
mass that Earth’s plants can produce, greatest proportional use of NPP. The
what proportion do human beings use influence of population is clear. For
(for food, clothing, shelter, etc.) or oth- the United Nations Food and Agriculture instance, although people in southern
erwise prevent from growing? This was Organization (FAO) and other sources. Asia consume very little per capita,
the question asked by nine environmen- They also gathered data on how people dense populations here result in a 63%
tal scientists led by Helmut Haberl of affect vegetation indirectly, such as use of NPP. In contrast, in sparsely
the Institute of Social Ecology in Austria. through fires, erosion and soil degrada- inhabited regions of the world (such
They teamed up to measure our tion, and other changes due to land
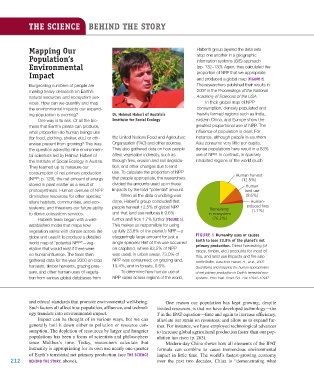
consumption of net primary production use. To calculate the proportion of NPP Human harvest
(NPP; p. 129), the net amount of energy that people appropriate, the researchers (12.5%)
stored in plant matter as a result of divided the amounts used up in these Human
photosynthesis. Human overuse of NPP impacts by the total “potential” amount. land use
diminishes resources for other species; When all the data crunching was (9.6%)
alters habitats, communities, and eco- done, Haberl’s group concluded that Human-
systems; and threatens our future ability people harvest 12.5% of global NPP Remaining induced fires
to derive ecosystem services. and that land use reduces it 9.6% in ecosystem (1.7%)
Haberl’s team began with a well- further and fires 1.7% further (Figure 1). (76.2%)
established model that maps how This makes us responsible for using
vegetation varies with climate across the up fully 23.8% of the planet’s NPP—a
globe and used it to produce a detailed staggeringly large amount for just a Figure 1 humanity uses or causes
world map of “potential NPP”—veg- single species! Half of this use occurred earth to lose 23.8% of the planet’s net
etation that would exist if there were on cropland, where 83.5% of NPP primary production. Direct harvesting (of
crops, timber, etc.) accounts for most of
no human influence. The team then was used. In urban areas, 73.0% of this, and land use impacts and fire also
gathered data for the year 2000 on crop NPP was consumed; on grazing land, contribute. Data from Haberl, H., et al., 2007.
harvests, timber harvests, grazing pres- 19.4%; and in forests, 6.6%. Quantifying and mapping the human appropriation
sure, and other human uses of vegeta- To determine how human use of of net primary production in Earth’s terrestrial eco-
tion from various global databases from NPP varies across regions of the world, systems. Proc. Natl. Acad. Sci. 104:12942–12947.
and ethical standards that promote environmental well-being. One reason our population has kept growing, despite
Such factors all affect how population, affluence, and technol- limited resources, is that we have developed technology—the
ogy translate into environmental impact. T in the IPAT equation—time and again to increase efficiency,
Impact can be thought of in various ways, but we can alleviate our strain on resources, and allow us to expand fur-
generally boil it down either to pollution or resource con- ther. For instance, we have employed technological advances
sumption. The depletion of resources by larger and hungrier to increase global agricultural production faster than our pop-
populations has been a focus of scientists and philosophers ulation has risen (p. 263).
since Malthus’s time. Today, researchers calculate that Modern-day China shows how all elements of the IPAT
humanity is appropriating for its own use nearly one-quarter formula can combine to cause tremendous environmental
of Earth’s terrestrial net primary production (see The Science impact in little time. The world’s fastest-growing economy
212 behind The STory, above). over the past two decades, China is “demonstrating what
M08_WITH7428_05_SE_C08.indd 212 12/12/14 2:58 PM