
Page 577 - Basic College Mathematics with Early Integers
P. 577
554 C HAPTE R 7 I STATISTICS AND PROBABILITY
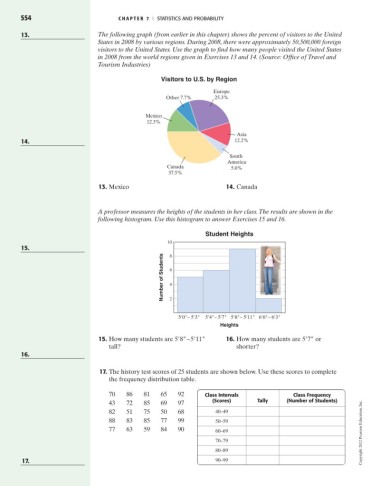
13. The following graph (from earlier in this chapter) shows the percent of visitors to the United
States in 2008 by various regions. During 2008, there were approximately 50,500,000 foreign
visitors to the United States. Use the graph to find how many people visited the United States
in 2008 from the world regions given in Exercises 13 and 14. (Source: Office of Travel and
Tourism Industries)
Visitors to U.S. by Region
Europe
Other 7.7% 25.3%
Mexico
12.3%
Asia
14. 12.2%
South
America
Canada 5.0%
37.5%
13. Mexico 14. Canada
A professor measures the heights of the students in her class.The results are shown in the
following histogram. Use this histogram to answer Exercises 15 and 16.
Student Heights
10
15. 8
Number of Students 6 4
2
5'0"– 5'3" 5'4"– 5'7" 5'8"– 5'11" 6'0"– 6'3"
Heights
15. How many students are 5¿8––5¿11– 16. How many students are 5¿7– or
tall? shorter?
16.
17. The history test scores of 25 students are shown below. Use these scores to complete
the frequency distribution table.
70 86 81 65 92 Class Intervals Class Frequency
43 72 85 69 97 (Scores) Tally (Number of Students)
82 51 75 50 68 40–49
88 83 85 77 99 50–59
77 63 59 84 90 60–69 Copyright 2012 Pearson Education, Inc.
70–79
80–89
17. 90–99