
Page 576 - Basic College Mathematics with Early Integers
P. 576
CHAPTER 7 TEST 553
6. During which month(s) does 7 centimeters of precipitation normally occur?
6.
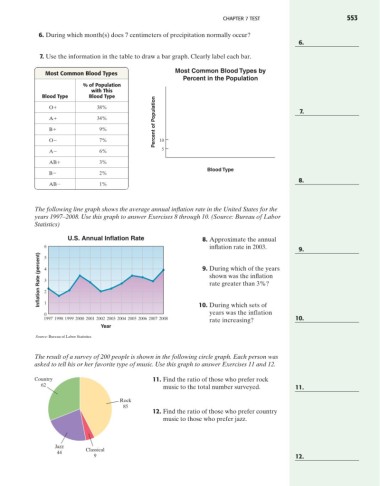
7. Use the information in the table to draw a bar graph. Clearly label each bar.
Most Common Blood Types Most Common Blood Types by
Percent in the Population
% of Population
with This
Blood Type Blood Type
Percent of Population
O+ 38% 7.
A+ 34%
B+ 9%
O- 7% 10
A- 6% 5
AB+ 3%
Blood Type
B- 2%
8.
AB- 1%
The following line graph shows the average annual inflation rate in the United States for the
years 1997–2008. Use this graph to answer Exercises 8 through 10. (Source: Bureau of Labor
Statistics)
U.S. Annual Inflation Rate 8. Approximate the annual
6 5 inflation rate in 2003. 9.
Inflation Rate (percent) 4 3 2 9. During which of the years
shown was the inflation
rate greater than 3%?
1
10. During which sets of
years was the inflation
0
1997 1998 1999 2000 2001 2002 2003 2004 2005 2006 2007 2008 rate increasing? 10.
Year
Source: Bureau of Labor Statistics
The result of a survey of 200 people is shown in the following circle graph. Each person was
asked to tell his or her favorite type of music. Use this graph to answer Exercises 11 and 12.
Country 11. Find the ratio of those who prefer rock
62
music to the total number surveyed. 11.
Rock
85
12. Find the ratio of those who prefer country
music to those who prefer jazz.
Jazz
44 Classical
9 12.