
Page 571 - Basic College Mathematics with Early Integers
P. 571
548 C HAPTE R 7 I STATISTICS AND PROBABILITY
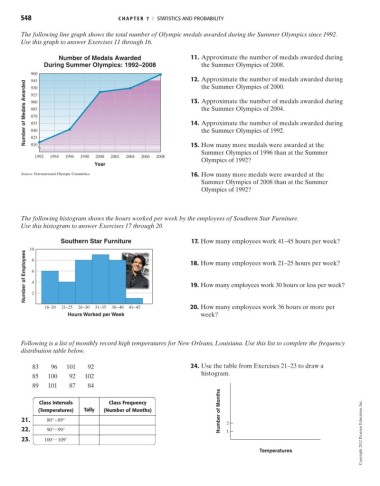
The following line graph shows the total number of Olympic medals awarded during the Summer Olympics since 1992.
Use this graph to answer Exercises 11 through 16.
Number of Medals Awarded 11. Approximate the number of medals awarded during
During Summer Olympics: 1992–2008 the Summer Olympics of 2008.
960
12. Approximate the number of medals awarded during
945
Number of Medals Awarded 900 13. Approximate the number of medals awarded during
the Summer Olympics of 2000.
930
915
the Summer Olympics of 2004.
885
870
14. Approximate the number of medals awarded during
855
the Summer Olympics of 1992.
840
825
810
15. How many more medals were awarded at the
Summer Olympics of 1996 than at the Summer
1992 1994 1996 1998 2000 2002 2004 2006 2008
Olympics of 1992?
Year
Source: International Olympic Committee 16. How many more medals were awarded at the
Summer Olympics of 2008 than at the Summer
Olympics of 1992?
The following histogram shows the hours worked per week by the employees of Southern Star Furniture.
Use this histogram to answer Exercises 17 through 20.
Southern Star Furniture 17. How many employees work 41–45 hours per week?
10 8
Number of Employees 6 4 18. How many employees work 21–25 hours per week?
19. How many employees work 30 hours or less per week?
2
16–20 21–25 26 –30 31–35 36 – 40 41– 45 20. How many employees work 36 hours or more per
Hours Worked per Week week?
Following is a list of monthly record high temperatures for New Orleans, Louisiana. Use this list to complete the frequency
distribution table below.
83 96 101 92 24. Use the table from Exercises 21–23 to draw a
histogram.
85 100 92 102
89 101 87 84
Number of Months
Class Intervals Class Frequency
(Temperatures) Tally (Number of Months)
21. 80°-89° 2
22. 90°-99° 1 Copyright 2012 Pearson Education, Inc.
23. 100°-109°
Temperatures