
Page 568 - Basic College Mathematics with Early Integers
P. 568
CHAPTER HIGHLIGHTS 545
Definitions and Concepts Examples
Section 7.1 Reading Pictographs, Bar Graphs, Histograms, and Line Graphs (continued)
2. About how many more acres of wheat were harvested
in North Dakota than South Dakota?
13 million
- 4 million
9 million or 9,000,000 acres
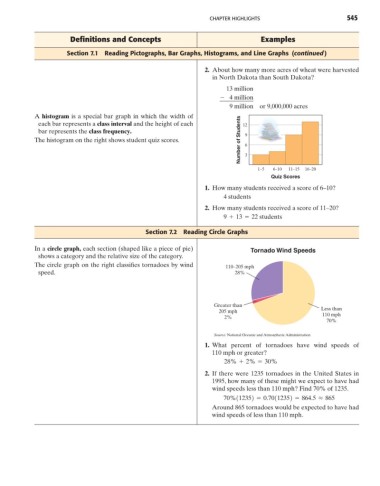
A histogram is a special bar graph in which the width of
Number of Students
each bar represents a class interval and the height of each 12
bar represents the class frequency. 9
The histogram on the right shows student quiz scores. 6
3
1–5 6–10 11–15 16–20
Quiz Scores
1. How many students received a score of 6–10?
4 students
2. How many students received a score of 11–20?
9 + 13 = 22 students
Section 7.2 Reading Circle Graphs
In a circle graph, each section (shaped like a piece of pie) Tornado Wind Speeds
shows a category and the relative size of the category.
The circle graph on the right classifies tornadoes by wind 110–205 mph
speed. 28%
Greater than
205 mph Less than
2% 110 mph
70%
Source: National Oceanic and Atmospheric Administration
1. What percent of tornadoes have wind speeds of
110 mph or greater?
28% + 2% = 30%
2. If there were 1235 tornadoes in the United States in
1995, how many of these might we expect to have had
wind speeds less than 110 mph? Find 70% of 1235.
70%112352 = 0.70112352 = 864.5 L 865
Around 865 tornadoes would be expected to have had
wind speeds of less than 110 mph.