Page 567 - Basic College Mathematics with Early Integers
P. 567

Chapter 7 Vocabulary Check


        Fill in each blank with one of the words or phrases listed below.
           outcomes      bar       experiment       mean        tree diagram
           pictograph    line      class interval   median      probability
           histogram     circle    class frequency  mode

         1. A(n)                  graph presents data using    9. A(n)                  is an activity being
           vertical or horizontal bars.                           considered, such as tossing a coin or rolling a die.
         2. The                  of a set of number items     10. In a(n)                 graph, each section
               sum of items                                       (shaped like a piece of pie) shows a category and
           is               .
             number of items                                      the relative size of the category.
         3. The possible results of an experiment are the     11. The                  of an event
                            .
                                                                    number of ways that
         4. A(n)                  is a graph in which pictures       the event can occur
           or symbols are used to visually present data.          is   number of possible  .
         5. The                  of a set of numbers is the              outcomes
           number that occurs most often.                     12. A(n)                  is a special bar graph in
         6. A(n)                  graph displays information      which the width of each bar represents a
           with a line that connects data points.                                  and the height of each bar
         7. The                  of an ordered set of numbers     represents the                .
           is the middle number.
         8. A(n)                  is one way to picture and
           count outcomes.
                                                                                    Are you preparing for your
                                                                     test? Don’t forget to take the Chapter 7 Test on
                                                                     page 552. Then check your answers at the back
                                                                     of your text and use the Chapter  Test Prep
                                                                     Videos to see the fully worked-out solutions to
         7       Chapter Highlights                                  any of the exercises you want to review.


                   Definitions and Concepts                                      Examples

                        Section 7.1  Reading Pictographs, Bar Graphs, Histograms, and Line Graphs


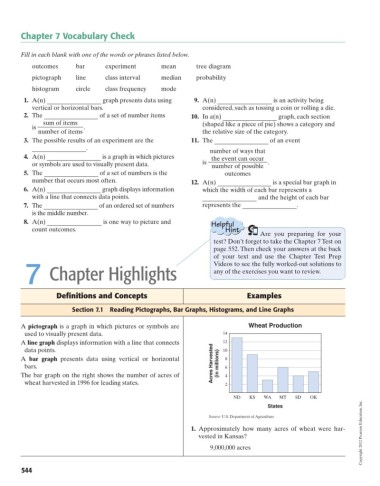
        A pictograph is a graph in which pictures or symbols are                Wheat Production
         used to visually present data.                                 14
        A line graph displays information with a line that connects     12
         data points.                                                   10
        A  bar graph presents data using vertical or horizontal          8
         bars.                                                       Acres Harvested  (in millions)  6
        The bar graph on the right shows the number of acres of          4
         wheat harvested in 1996 for leading states.                     2

                                                                            ND   KS  WA   MT   SD   OK
                                                                                                                    Copyright 2012 Pearson Education, Inc.
                                                                                      States
                                                                    Source: U.S. Department of Agriculture
                                                              1. Approximately how many acres of wheat were har-
                                                                vested in Kansas?
                                                                    9,000,000 acres


        544
   562   563   564   565   566   567   568   569   570   571   572