Page 572 - Basic College Mathematics with Early Integers
P. 572

CHAPTER 7 REVIEW                          549


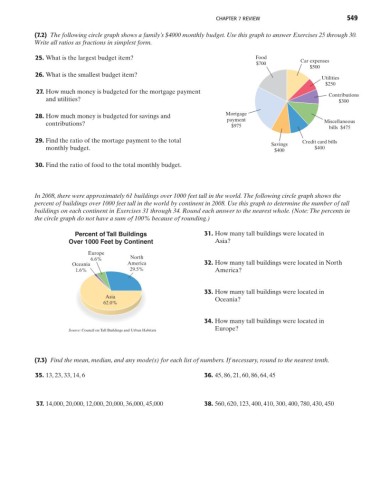
            (7.2) The following circle graph shows a family’s $4000 monthly budget. Use this graph to answer Exercises 25 through 30.
            Write all ratios as fractions in simplest form.

            25. What is the largest budget item?                                   Food          Car expenses
                                                                                   $700
                                                                                                    $500
            26. What is the smallest budget item?
                                                                                                        Utilities
                                                                                                         $250
            27. How much money is budgeted for the mortgage payment
                                                                                                          Contributions
                and utilities?                                                                               $300
                                                                         Mortgage
            28. How much money is budgeted for savings and
                                                                         payment                         Miscellaneous
                contributions?                                             $975                           bills  $475

            29. Find the ratio of the mortage payment to the total                               Credit card bills
                                                                                        Savings
                monthly budget.                                                          $400        $400

            30. Find the ratio of food to the total monthly budget.


            In 2008, there were approximately 61 buildings over 1000 feet tall in the world.The following circle graph shows the
            percent of buildings over 1000 feet tall in the world by continent in 2008. Use this graph to determine the number of tall
            buildings on each continent in Exercises 31 through 34. Round each answer to the nearest whole. (Note:The percents in
            the circle graph do not have a sum of 100% because of rounding.)

                         Percent of Tall Buildings                31. How many tall buildings were located in
                       Over 1000 Feet by Continent                    Asia?
                             Europe
                                           North
                              6.6%
                        Oceania           America                 32. How many tall buildings were located in North
                         1.6%             29.5%                       America?


                                                                  33. How many tall buildings were located in
                                   Asia
                                  62.0%                               Oceania?


                                                                  34. How many tall buildings were located in
                                                                      Europe?
                       Source: Council on Tall Buildings and Urban Habitats


            (7.3) Find the mean, median, and any mode(s) for each list of numbers. If necessary, round to the nearest tenth.
            35. 13, 23, 33, 14, 6                                 36. 45, 86, 21, 60, 86, 64, 45


            37. 14,000, 20,000, 12,000, 20,000, 36,000, 45,000    38. 560, 620, 123, 400, 410, 300, 400, 780, 430, 450
   567   568   569   570   571   572   573   574   575   576   577