
Page 575 - Basic College Mathematics with Early Integers
P. 575
Step-by-step test solutions are found on the Chapter Test Prep
Chapter 7 Test Videos available via the Interactive DVD Lecture Series, in
or on (search “MartinGayBasicMathEI” and click
on “Channels”).
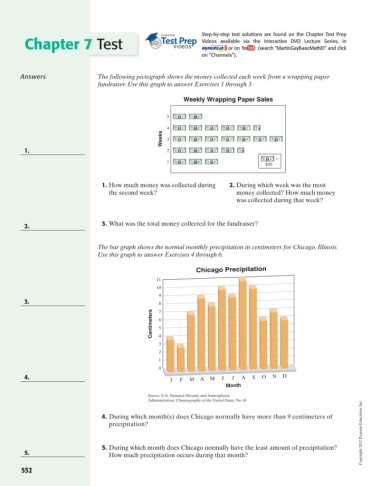
Answers The following pictograph shows the money collected each week from a wrapping paper
fundraiser. Use this graph to answer Exercises 1 through 3.
Weekly Wrapping Paper Sales
5
4
Weeks 3
1. 2
1
$50
1. How much money was collected during 2. During which week was the most
the second week? money collected? How much money
was collected during that week?
3. What was the total money collected for the fundraiser?
2.
The bar graph shows the normal monthly precipitation in centimeters for Chicago, Illinois.
Use this graph to answer Exercises 4 through 6.
Chicago Precipitation
11
10
9
3. 8 7
Centimeters 6 5
3 4
2
1
0
4. M J J A S O N D
J F M A
Month
Source: U.S. National Oceanic and Atmospheric
Administration, Climatography of the United States, No. 81
Copyright 2012 Pearson Education, Inc.
4. During which month(s) does Chicago normally have more than 9 centimeters of
precipitation?
5. During which month does Chicago normally have the least amount of precipitation?
5.
How much precipitation occurs during that month?
552