
Page 570 - Basic College Mathematics with Early Integers
P. 570
Chapter 7 Review
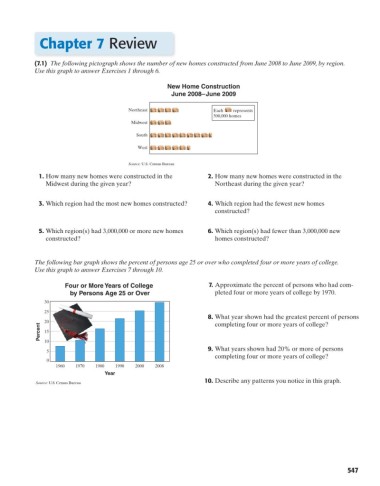
(7.1) The following pictograph shows the number of new homes constructed from June 2008 to June 2009, by region.
Use this graph to answer Exercises 1 through 6.
New Home Construction
June 2008–June 2009
Northeast Each represents
500,000 homes
Midwest
South
West
Source: U.S. Census Bureau
1. How many new homes were constructed in the 2. How many new homes were constructed in the
Midwest during the given year? Northeast during the given year?
3. Which region had the most new homes constructed? 4. Which region had the fewest new homes
constructed?
5. Which region(s) had 3,000,000 or more new homes 6. Which region(s) had fewer than 3,000,000 new
constructed? homes constructed?
The following bar graph shows the percent of persons age 25 or over who completed four or more years of college.
Use this graph to answer Exercises 7 through 10.
Four or More Years of College 7. Approximate the percent of persons who had com-
by Persons Age 25 or Over pleted four or more years of college by 1970.
30
25
8. What year shown had the greatest percent of persons
20 completing four or more years of college?
Percent 15
10
9. What years shown had 20% or more of persons
5
completing four or more years of college?
0
1960 1970 1980 1990 2000 2008
Year
10. Describe any patterns you notice in this graph.
Source: U.S. Census Bureau
547