
Page 12 - How long will it take me to heal and why?
P. 12
Corrective care vs Patch job
Notice in the following two charts the
difference between the patch job strategy and the
corrective care strategy. In each case, the patient
has undergone treatments over ten weeks, with an
improvement of 3% after each treatment.
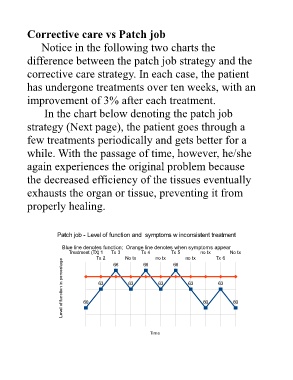
In the chart below denoting the patch job
strategy (Next page), the patient goes through a
few treatments periodically and gets better for a
while. With the passage of time, however, he/she
again experiences the original problem because
the decreased efficiency of the tissues eventually
exhausts the organ or tissue, preventing it from
properly healing.
Patch job - Level of function and symptoms w inconsistent treatment
Blue line denotes function; Orange line denotes when symptoms appear
Treatment (TX) 1 Tx 3 Tx 4 Tx 5 no tx No tx
Tx 2 66 No tx 66 no tx 66 no tx Tx 6
Level of function in percentage 60 63 63 63 63 60 63 60
Time