Page 29 - FINAL CFA II SLIDES JUNE 2019 DAY 9
P. 29

LOS 34.l: Explain how a bond’s exposure to each of the                                    READING 34: THE TERM STRUCTURE AND
    factors driving the yield curve can be measured and how these                                              INTEREST RATE DYNAMICS
    exposures can be used to manage yield curve risks.
                                                                                                 MODULE 34.6: INTEREST RATE MODELS


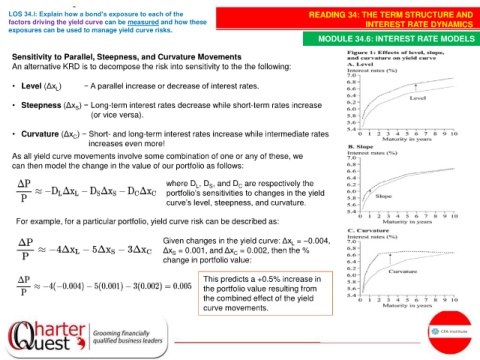
     Sensitivity to Parallel, Steepness, and Curvature Movements
     An alternative KRD is to decompose the risk into sensitivity to the the following:

     • Level (Δx )          − A parallel increase or decrease of interest rates.
                  L

     • Steepness (Δx ) − Long-term interest rates decrease while short-term rates increase
                        S
                            (or vice versa).

     • Curvature (Δx ) − Short- and long-term interest rates increase while intermediate rates
                       C
                            increases even more!
     As all yield curve movements involve some combination of one or any of these, we
     can then model the change in the value of our portfolio as follows:


                                                   where D , D , and D are respectively the
                                                            L
                                                                S
                                                                         C
                                                   portfolio’s sensitivities to changes in the yield
                                                   curve’s level, steepness, and curvature.
      For example, for a particular portfolio, yield curve risk can be described as:

                                                  Given changes in the yield curve: Δx = –0.004,
                                                                                         L
                                                  Δx = 0.001, and Δx = 0.002, then the %
                                                                       C
                                                     S
                                                  change in portfolio value:

                                                              This predicts a +0.5% increase in
                                                              the portfolio value resulting from
                                                              the combined effect of the yield
                                                              curve movements.
   24   25   26   27   28   29   30   31   32   33   34