
Page 64 - FINAL CFA SLIDES JUNE 2019 DAY 2
P. 64
Session Unit 2:
LOS 8.m: Compare the use of AM and GMs 8. Statistical Concepts and Market Returns (A/B)
when analyzing investment returns, p.155/156
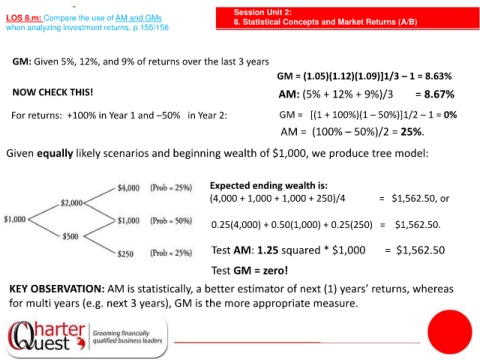
GM: Given 5%, 12%, and 9% of returns over the last 3 years
GM = (1.05)(1.12)(1.09)]1/3 – 1 = 8.63%
NOW CHECK THIS! AM: (5% + 12% + 9%)/3 = 8.67%
For returns: +100% in Year 1 and –50% in Year 2: GM = [(1 + 100%)(1 – 50%)]1/2 – 1 = 0%
AM = (100% – 50%)/2 = 25%.
Given equally likely scenarios and beginning wealth of $1,000, we produce tree model:
Expected ending wealth is:
(4,000 + 1,000 + 1,000 + 250)/4 = $1,562.50, or
0.25(4,000) + 0.50(1,000) + 0.25(250) = $1,562.50.
Test AM: 1.25 squared * $1,000 = $1,562.50
Test GM = zero!
KEY OBSERVATION: AM is statistically, a better estimator of next (1) years’ returns, whereas
for multi years (e.g. next 3 years), GM is the more appropriate measure.