
Page 14 - FINAL CFA II SLIDES JUNE 2019 DAY 8
P. 14
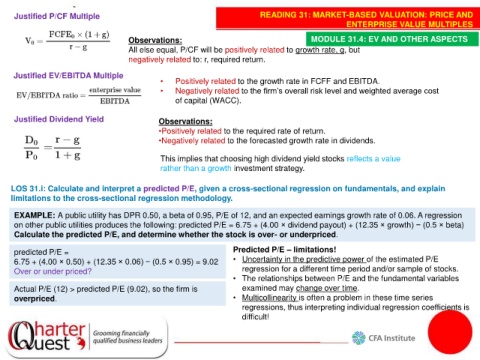
Justified P/CF Multiple                                                   READING 31: MARKET-BASED VALUATION: PRICE AND
                                                                                                         ENTERPRISE VALUE MULTIPLES

                                        Observations:                                         MODULE 31.4: EV AND OTHER ASPECTS
                                        All else equal, P/CF will be positively related to growth rate, g, but
                                        negatively related to: r, required return.

     Justified EV/EBITDA Multiple
                                                 •    Positively related to the growth rate in FCFF and EBITDA.
                                                 •    Negatively related to the firm’s overall risk level and weighted average cost
                                                      of capital (WACC).


     Justified Dividend Yield                    Observations:
                                                 •Positively related to the required rate of return.
                                                 •Negatively related to the forecasted growth rate in dividends.

                                                 This implies that choosing high dividend yield stocks reflects a value
                                                 rather than a growth investment strategy.

    LOS 31.i: Calculate and interpret a predicted P/E, given a cross-sectional regression on fundamentals, and explain
    limitations to the cross-sectional regression methodology.


     EXAMPLE: A public utility has DPR 0.50, a beta of 0.95, P/E of 12, and an expected earnings growth rate of 0.06. A regression
     on other public utilities produces the following: predicted P/E = 6.75 + (4.00 × dividend payout) + (12.35 × growth) − (0.5 × beta)
     Calculate the predicted P/E, and determine whether the stock is over- or underpriced.

     predicted P/E =                                                   Predicted P/E – limitations!
     6.75 + (4.00 × 0.50) + (12.35 × 0.06) − (0.5 × 0.95) = 9.02       • Uncertainty in the predictive power of the estimated P/E
     Over or under priced?                                                regression for a different time period and/or sample of stocks.
                                                                       • The relationships between P/E and the fundamental variables
     Actual P/E (12) > predicted P/E (9.02), so the firm is               examined may change over time.
     overpriced.                                                       • Multicollinearity is often a problem in these time series
                                                                          regressions, thus interpreting individual regression coefficients is
                                                                          difficult!