
Page 9 - PMB-2018-Catalog-WEB-3
P. 9
Using the information to make
your genetic selection
PMB recommends this approach
First, remember that the genetics of your cow herd are fixed and are not impacted by your mating decisions.
The genetic impact of your decisions will be reflected in your calf crops.
seLect tHe Genetics WHicH support your business pLan
The $Indexes summarize the interaction of many of the often conflicting genetic traits. They are based on EPDs
provided by the American Angus Association – give them a good look to see how the profitability of your business
plan may be impacted by alternative sire selections.
The individual EPDs are ranked by the American Angus Association as to where that individual ranks within the
entire Angus population. If the rank for a trait shows an EPD Percentile of 10, it means that animal is in the highest
10% of the breed for that trait. Conversely, it means that 90% of the entire Angus Breed ranks lower.
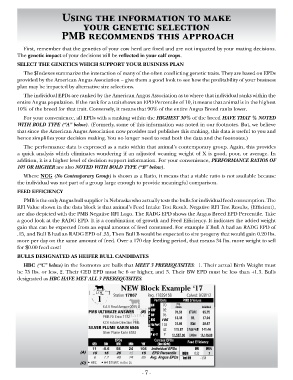
For your convenience, all EPDs with a ranking within the HiGHest 30% of the breed HAVe tHAt % Noted
witH Bold tYPe (“A” below). (Formerly, some of this information was noted in our footnotes. But, we believe
that since the American Angus Association now provides and publishes this ranking, this data is useful to you and
hence simplifies your decision making. You no longer need to read both the data and the footnotes.)
The performance data is expressed as a ratio within that animal’s contemporary group. Again, this provides
a quick analysis which eliminates wondering if an adjusted weaning weight of X is good, poor, or average. In
addition, it is a higher level of decision support information. For your convenience, PeRFoRMANce RAtios oF
105 oR HiGHeR are also Noted witH Bold tYPe (“B” below).
Where ncG (No contemporary Group) is shown as a Ratio, it means that a viable ratio is not available because
the individual was not part of a group large enough to provide meaningful comparison.
feed efficiency
PMB is the only Angus bull supplier in Nebraska who actually tests the bulls for individual feed consumption. The
RFI Value shown in the data block is that animal’s Feed Intake Test Result. Negative RFI Test Results, (Efficient),
are also depicted with the PMB Negative RFI Logo. The RADG EPD shows the Angus Breed EPD Percentile. Take
a good look at the RADG EPD. It is a combination of growth and Feed Efficiency. It indicates the added weight
gain that can be expected from an equal amount of feed consumed. For example if Bull A had an RADG EPD of
.15, and Bull B had an RADG EPD of .35, Then Bull B would be expected to sire progeny that would gain 0.20 lbs.
more per day on the same amount of feed. Over a 170 day feeding period, that means 34 lbs. more weight to sell
for $0.00 feed cost!
buLLs desiGnated as Heifer buLL candidates
Hbc (“c” below) in the footnotes are bulls that Meet 3 PReReQuisites: 1. Their actual Birth Weight must
be 75 lbs. or less, 2. Their CED EPD must be 6 or higher, and 3. Their BW EPD must be less than +1.3. Bulls
designated as HBc HAVe Met All 3 PReReQuisites.
neW block example ‘17
LOT Station 17867 Reg. 17829158 Calved: 9/28/13
1 Perf Data PMB $ Values
Avg.
S A V Final Answer 0035 # BW 70 Angus Individual
PMB UltiMate answer (B) R WW 92 70.53 $TSWC 95.75
A
PMB FD Erica 7132 T YW 95 13.48 $FL 17.04
105
ADG
I
KCR Future DIrection PMB O Fin Perf 103 31.86 $Grid 28.67
silver PlUMe Karin 6846 SC 42 115.87 $ Total Profit 141.46
Silver Plume Karin 6583
P or V P 11,587.00 Lifetime 14,146.00
EPDs Carcass EPDs Feed Efficiency
CED BW WW Milk YW (See $Grid)
11 -0.6 56 24 106 Individual EPDs EPD EPD%
(A) 15 15 25 45 15 EPD Percentile RADG 0.32 1
6 1.2 48 24 85 Avg. Angus EPDs Test RFI -1.54
(C) • HBC • #4 $TSWC in the 2s
- 7 -