
Page 8 - PMB-2018-Catalog-WEB-3
P. 8
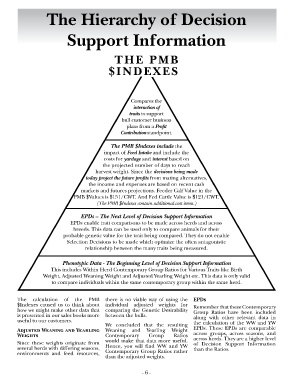
the Hierarchy of decision


                             support information


                                                 tHe pmb

                                              $indexes


                                                        Compares the
                                                         interaction of
                                                       traits to support
                                                    bull customer business
                                                      plans from a Profit
                                                   contribution standpoint.

                                               the PMB $indexes include the
                                            impact of Feed intake and include the
                                            costs for yardage and interest based on
                                            the projected number of days to reach
                                         harvest weight. Since the decisions being made
                                     today project the future profits from mating alternatives,
                                      the income and expenses are based on recent cash
                                   markets and futures projections. Feeder Calf Value in the
                                PMB $Values is $151/CWT. And Fed Cattle Value is $121/CWT.
                                         (The PMB $Indexes contain additional cost items.)


                                   ePds – the Next level of decision support information
                              EPDs enable trait comparisons to be made across herds and across
                                breeds. This data can be used only to compare animals for their
                           probable genetic value for the trait being compared. They do not enable
                             Selection Decisions to be made which optimize the often antagonistic
                                    relationship between the many traits being measured.


                           Phenotypic data - the Beginning level of decision support information
                      This includes Within Herd Contemporary Group Ratios for Various Traits like Birth
                   Weight, Adjusted Weaning Weight and Adjusted Yearling Weight etc. This data is only valid
                       to compare individuals within the same contemporary group within the same herd.


        The calculation of the PMB  there is no viable way of using the  EPDs
        $Indexes caused us to think about  individual adjusted weights for        Remember that these Contemporary
        how we might make other data that  comparing the Genetic Desirability     Group Ratios have been included
        is presented in our sales books more  between the bulls.                  along with other relevant data in
        useful to our customers.                                                  the calculation of the WW and YW
                                             We concluded that the resulting
        Adjusted Weaning and Yearling  Weaning  and  Yearling  Weight             EPDs. These EPDs are comparable
        Weights                              Contemporary      Group      Ratios  across groups, across seasons, and
                                                                                  across herds. They are a higher level
        Since these weights originate from   would make that data more useful.    of Decision Support Information
        several herds with differing seasons,    Hence, you will find WW and YW   than the Ratios.
        environments  and  feed  resources,   Contemporary Group Ratios rather
                                             than the adjusted weights.


                                                            - 6 -