
Page 10 - Improved +Example+Assessment+Report (LG Accrual) {FlipBook Test v1}_Neat (Online upload)
P. 10
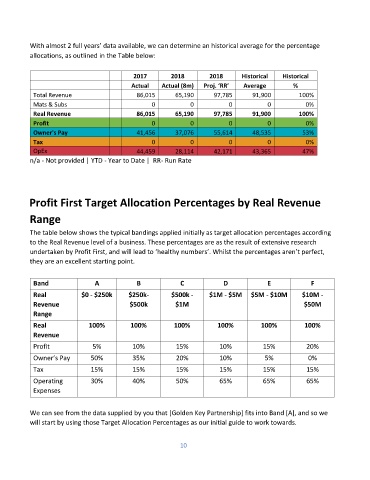
With almost 2 full years’ data available, we can determine an historical average for the percentage
           allocations, as outlined in the Table below:

                                             2017         2018        2018       Historical    Historical
                                            Actual     Actual (8m)   Proj. ‘RR’   Average         %
            Total Revenue                     86,015       65,190       97,785       91,900         100%
            Mats & Subs                            0            0            0            0           0%
            Real Revenue                      86,015       65,190       97,785       91,900         100%
            Profit                                 0            0            0            0           0%
            Owner's Pay                       41,456       37,076       55,614       48,535          53%
            Tax                                    0            0            0            0           0%
            OpEx                              44,459       28,114       42,171       43,365          47%
           n/a - Not provided | YTD - Year to Date |  RR- Run Rate


           Profit First Target Allocation Percentages by Real Revenue

           Range

           The table below shows the typical bandings applied initially as target allocation percentages according
           to the Real Revenue level of a business. These percentages are as the result of extensive research
           undertaken by Profit First, and will lead to ‘healthy numbers’. Whilst the percentages aren’t perfect,
           they are an excellent starting point.


            Band                A             B              C             D              E             F
            Real            $0 - $250k      $250k-        $500k -     $1M - $5M  $5M - $10M          $10M -
            Revenue                         $500k          $1M                                        $50M
            Range
            Real              100%          100%           100%          100%          100%           100%
            Revenue

            Profit              5%           10%           15%            10%           15%           20%
            Owner’s Pay        50%           35%           20%            10%            5%            0%

            Tax                15%           15%           15%            15%           15%           15%
            Operating          30%           40%           50%            65%           65%           65%
            Expenses

           We can see from the data supplied by you that [Golden Key Partnership] fits into Band [A], and so we
           will start by using those Target Allocation Percentages as our initial guide to work towards.


                                                             10