
Page 8 - Improved +Example+Assessment+Report (LG Accrual) {FlipBook Test v1}_Neat (Online upload)
P. 8
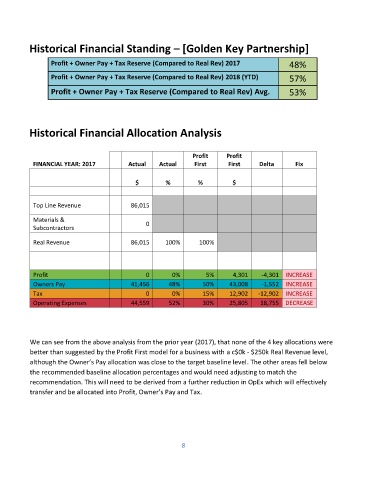
Historical Financial Standing – [Golden Key Partnership]

                  Profit + Owner Pay + Tax Reserve (Compared to Real Rev) 2017                   48%

                  Profit + Owner Pay + Tax Reserve (Compared to Real Rev) 2018 (YTD)             57%

                  Profit + Owner Pay + Tax Reserve (Compared to Real Rev) Avg.                   53%


           Historical Financial Allocation Analysis


                                                                 Profit     Profit
            FINANCIAL YEAR: 2017           Actual     Actual     First       First     Delta       Fix


                                              $         %          %          $


            Top Line Revenue                86,015

            Materials &
            Subcontractors                       0

            Real Revenue                    86,015      100%       100%


            Profit                               0        0%         5%       4,301     -4,301  INCREASE
            Owners Pay                      41,456       48%        50%      43,008     -1,552  INCREASE
            Tax                                  0        0%        15%      12,902   -12,902  INCREASE
            Operating Expenses              44,559       52%        30%      25,805    18,755  DECREASE


           We can see from the above analysis from the prior year (2017), that none of the 4 key allocations were
           better than suggested by the Profit First model for a business with a c$0k - $250k Real Revenue level,
           although the Owner’s Pay allocation was close to the target baseline level. The other areas fell below
           the recommended baseline allocation percentages and would need adjusting to match the
           recommendation. This will need to be derived from a further reduction in OpEx which will effectively
           transfer and be allocated into Profit, Owner’s Pay and Tax.


                                                             8