
Page 103 - AnnualEducationReport2018-19
P. 103
04/10/2019 Number % Did Not Did Not Meet % Met or Met or Benchmark Assessed Meet Exceeded Exceeded 1,444 71.5% 1,032 28.5% 412 480 1,549 65.2% 1,010 34.8% 539 480 103,689 41.8% 43,344 58.2% 60,345 480 104,356 39.3% 41,050 60.7% 63,306 480 105,139 63.1% 66,315 36.9% 38,824 530 105,983 63.2% 66,929 36.8% 39,054 530 674 77.2% 520 22.8% 154 530 636 74.8% 476 25.2% 160 530 3,810 32.0% 1,219 68.0% 2,591 530 3,834 30.9% 1,186 69.1% 2,648 530 16,528 90.0% 14,873 10.0% 1,655 530 15,848 89.9% 14,242 10.1% 1,606 530 6,739 79.2% 5,335 20.8
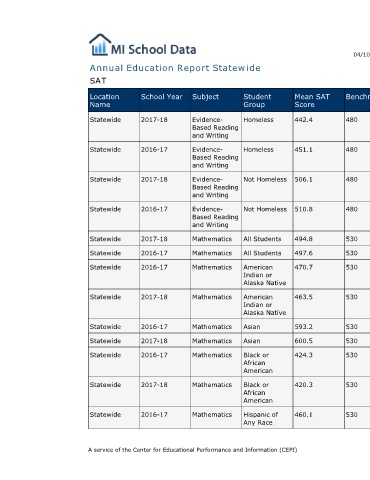
Mean SAT Score 442.4 451.1 506.1 510.8 494.8 497.6 470.7 463.5 593.2 600.5 424.3 420.3 460.1
Student Group Homeless Homeless Not Homeless Not Homeless All Students All Students American Indian or Alaska Native American Indian or Alaska Native Asian Asian Black or African American Black or African American Hispanic of Any Race
Annual Education Report Statewide
Subject Evidence- Based Reading and Writing Evidence- Based Reading and Writing Evidence- Based Reading and Writing Evidence- Based Reading and Writing Mathematics Mathematics Mathematics Mathematics Mathematics Mathematics Mathematics Mathematics Mathematics A service of the Center for Educational Performance and Information (CEPI)
School Year 2017-18 2016-17 2017-18 2016-17 2017-18 2016-17 2016-17 2017-18 2016-17 2017-18 2016-17 2017-18 2016-17
SAT Location Name Statewide Statewide Statewide Statewide Statewide Statewide Statewide Statewide Statewide Statewide Statewide Statewide Statewide