
Page 104 - AnnualEducationReport2018-19
P. 104
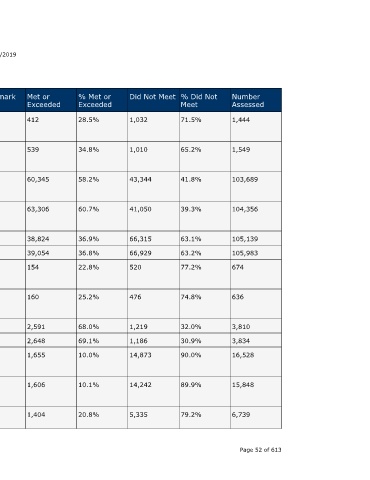
Number  Assessed  1,444  1,549  103,689  104,356  105,139  105,983  674  636  3,810  3,834  16,528  15,848  6,739   Page 52 of 613


                                  % Did Not  Meet  71.5%  65.2%  41.8%  39.3%    63.1%  63.2%  77.2%  74.8%   32.0%  30.9%  90.0%  89.9%   79.2%


                                  Did Not Meet  1,032  1,010  43,344   41,050    66,315  66,929  520  476     1,219  1,186  14,873  14,242  5,335


                                  % Met or  Exceeded  28.5%  34.8%  58.2%  60.7%  36.9%  36.8%  22.8%  25.2%  68.0%  69.1%  10.0%  10.1%   20.8%


                                  Met or  Exceeded  412  539  60,345   63,306    38,824  39,054  154  160     2,591  2,648  1,655  1,606   1,404


                    04/10/2019    Benchmark  480   480       480       480       530  530  530      530       530  530  530      530       530


                                  Mean SAT  Score  442.4  451.1  506.1  510.8    494.8  497.6  470.7  463.5   593.2  600.5  424.3  420.3   460.1


                                  Student  Group  Homeless  Homeless  Not Homeless  Not Homeless  All Students  All Students  American  Indian or  Alaska Native  American  Indian or  Alaska Native  Asian  Asian  Black or  African  American  Black or  African  American  Hispanic of  Any Race
                        Annual Education Report Statewide


                                  Subject  Evidence-  Based Reading  and Writing  Evidence-  Based Reading  and Writing  Evidence-  Based Reading  and Writing  Evidence-  Based Reading  and Writing  Mathematics  Mathematics  Mathematics  Mathematics  Mathematics  Mathematics  Mathematics  Mathematics  Mathematics A service of the Center for Educational Performance and Information (CEPI)


                                  School Year  2017-18  2016-17  2017-18  2016-17  2017-18  2016-17  2016-17  2017-18  2016-17  2017-18  2016-17  2017-18  2016-17


                             SAT  Location  Name  Statewide  Statewide  Statewide  Statewide  Statewide  Statewide  Statewide  Statewide  Statewide  Statewide  Statewide  Statewide  Statewide