
Page 108 - AnnualEducationReport2018-19
P. 108
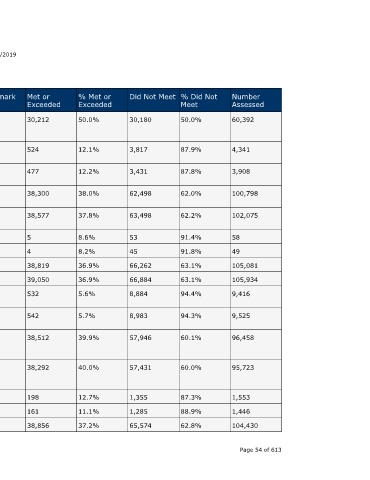
Number  Assessed  60,392  4,341  3,908  100,798  102,075  58  49  105,081  105,934  9,416  9,525  96,458  95,723  1,553  1,446  104,430  Page 54 of 613


                                  % Did Not  Meet  50.0%  87.9%  87.8%  62.0%  62.2%  91.4%  91.8%  63.1%  63.1%  94.4%  94.3%  60.1%  60.0%  87.3%  88.9%  62.8%


                                  Did Not Meet  30,180  3,817  3,431  62,498  63,498  53  45  66,262  66,884  8,884  8,983  57,946  57,431  1,355  1,285  65,574


                                  % Met or  Exceeded  50.0%  12.1%  12.2%  38.0%  37.8%  8.6%  8.2%  36.9%  36.9%  5.6%  5.7%  39.9%  40.0%  12.7%  11.1%  37.2%


                                  Met or  Exceeded  30,212  524  477  38,300  38,577  5  4  38,819  39,050  532  542  38,512  38,292  198  161  38,856


                    04/10/2019    Benchmark  530   530    530     530    530    530  530  530  530  530   530    530       530       530  530  530


                                  Mean SAT  Score  529.3  422.6  427.6  497.9  500.3  429.7  428.0  494.8  497.6  393.4  400.7  507.2  504.8  432.1  420.8  498.6


                                  Student  Group  Not  Economically  Disadvantaged  English  Learners  English  Learners  Not English  Learners  Not English  Learners  Migrant  Migrant  Not Migrant  Not Migrant  Students With  Disabilities  Students With  Disabilities  Students  Without  Disabilities  Students  Without  Disabilities  Homeless  Homeless  Not Homeless
                        Annual Education Report Statewide


                                  Subject  Mathematics  Mathematics  Mathematics  Mathematics  Mathematics  Mathematics  Mathematics  Mathematics  Mathematics  Mathematics  Mathematics  Mathematics  Mathematics  Mathematics  Mathematics  Mathematics A service of the Center for Educational Performance and Information (CEPI)


                                  School Year  2017-18  2017-18  2016-17  2017-18  2016-17  2017-18  2016-17  2017-18  2016-17  2017-18  2016-17  2016-17  2017-18  2016-17  2017-18  2016-17


                             SAT  Location  Name  Statewide  Statewide  Statewide  Statewide  Statewide  Statewide  Statewide  Statewide  Statewide  Statewide  Statewide  Statewide  Statewide  Statewide  Statewide  Statewide