
Page 105 - AnnualEducationReport2018-19
P. 105
04/10/2019 Number % Did Not Did Not Meet % Met or Met or Benchmark Assessed Meet Exceeded Exceeded 7,166 78.6% 5,634 21.4% 1,532 530 132 59.1% 78 40.9% 54 530 91 62.6% 57 37.4% 34 530 2,807 66.6% 1,869 33.4% 938 530 2,957 67.2% 1,987 32.8% 970 530 75,293 57.2% 43,035 42.8% 32,258 530 74,607 57.3% 42,733 42.7% 31,874 530 53,179 65.3% 34,745 34.7% 18,434 530 52,473 65.0% 34,131 35.0% 18,342 530 52,804 60.9% 32,184 39.1% 20,620 530 52,666 61.1% 32,184 38.9% 20,482 530 39,456 82.3% 32,487 17.7% 6,969 530 44,747 80.8% 36,135 19.2% 8
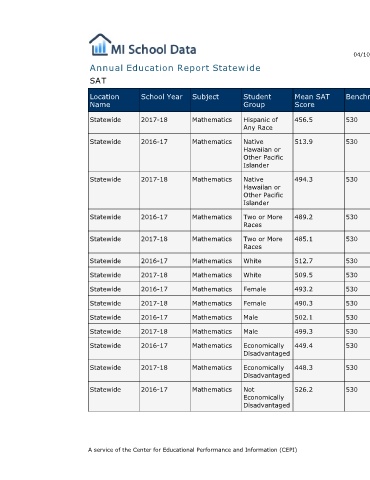
Mean SAT Score 456.5 513.9 494.3 489.2 485.1 512.7 509.5 493.2 490.3 502.1 499.3 449.4 448.3 526.2
Student Group Hispanic of Any Race Native Hawaiian or Other Pacific Islander Native Hawaiian or Other Pacific Islander Two or More Races Two or More Races White White Female Female Male Male Economically Disadvantaged Economically Disadvantaged Not Economically Disadvantaged
Annual Education Report Statewide
Subject Mathematics Mathematics Mathematics Mathematics Mathematics Mathematics Mathematics Mathematics Mathematics Mathematics Mathematics Mathematics Mathematics Mathematics A service of the Center for Educational Performance and Information (CEPI)
School Year 2017-18 2016-17 2017-18 2016-17 2017-18 2016-17 2017-18 2016-17 2017-18 2016-17 2017-18 2016-17 2017-18 2016-17
SAT Location Name Statewide Statewide Statewide Statewide Statewide Statewide Statewide Statewide Statewide Statewide Statewide Statewide Statewide Statewide