
Page 107 - AnnualEducationReport2018-19
P. 107
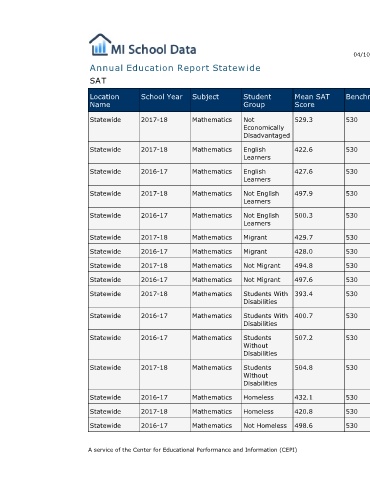
04/10/2019    Number % Did Not Did Not Meet % Met or  Met or Benchmark  Assessed  Meet Exceeded Exceeded  60,392  50.0%  30,180  50.0%  30,212  530  4,341 87.9%  3,817  12.1%  524  530  3,908  87.8%  3,431  12.2%  477  530  100,798  62.0%  62,498  38.0%  38,300  530  102,075  62.2%  63,498  37.8%  38,577  530  58  91.4%  53  8.6%  5  530  49  91.8%  45  8.2%  4  530  105,081  63.1%  66,262  36.9%  38,819  530  105,934  63.1%  66,884  36.9%  39,050  530  9,416  94.4%  8,884  5.6%  532  530  9,525  94.3%  8,983  5.7%  542  530  96,458  60.1%  57,946  39.9%  38,512  530  95,723  60.0%  57,431  40.0%  38,292


                                  Mean SAT  Score  529.3  422.6  427.6  497.9  500.3  429.7  428.0  494.8  497.6  393.4  400.7  507.2  504.8  432.1  420.8  498.6


                                  Student  Group  Not  Economically  Disadvantaged  English  Learners  English  Learners  Not English  Learners  Not English  Learners  Migrant  Migrant  Not Migrant  Not Migrant  Students With  Disabilities  Students With  Disabilities  Students  Without  Disabilities  Students  Without  Disabilities  Homeless  Homeless  Not Homeless
                        Annual Education Report Statewide


                                  Subject  Mathematics  Mathematics  Mathematics  Mathematics  Mathematics  Mathematics  Mathematics  Mathematics  Mathematics  Mathematics  Mathematics  Mathematics  Mathematics  Mathematics  Mathematics  Mathematics A service of the Center for Educational Performance and Information (CEPI)


                                  School Year  2017-18  2017-18  2016-17  2017-18  2016-17  2017-18  2016-17  2017-18  2016-17  2017-18  2016-17  2016-17  2017-18  2016-17  2017-18  2016-17


                             SAT  Location  Name  Statewide  Statewide  Statewide  Statewide  Statewide  Statewide  Statewide  Statewide  Statewide  Statewide  Statewide  Statewide  Statewide  Statewide  Statewide  Statewide