
Page 211 - AR DPBM-2016--SMALL
P. 211
Analisis & Pembahasan Manajemen Tata Kelola Dana Pensiun Laporan Keuangan Konsolidasi
Management Discussion & Analysis Good Pension Fund Governance Consolidated Financial Report
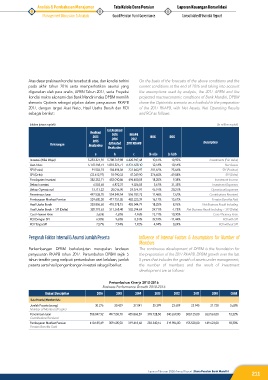
Atas dasar prakiraan kondisi tersebut di atas, dan kondisi terkini On the basis of the forecasts of the above conditions and the
pada akhir tahun 2016 serta memperhatikan asumsi yang current conditions at the end of 2016 and taking into account
digunakan oleh para analis, APBN Tahun 2017, serta Proyeksi the assumptions used by analysts, the 2017 APBN and the
kondisi makro ekonomi dari Bank Mandiri maka DPBM memilih projected macroeconomic conditions of Bank Mandiri, DPBM
skenario Optimis sebagai pijakan dalam penyusunan RKAPB chose the Optimistic scenario as a foothold in the preparation
2017, dengan target Aset Neto, Hasil Usaha Bersih dan ROI of the 2017 RKAPB, with Net Assets, Net Operating Results
sebagai berikut: and ROI as follows:
(dalam jutaan rupiah) (in million rupiah)
Est.Realisasi
Realisasi 2016 RKAPB
2015 ROG ROG
2015 2016 2017
Keterangan Realization Estimated 2017 RKAPB Description
Realization
a b c (b-a)/a (c-b)/b
Investasi (Nilai Wajar) 5.233.321,92 5.788.769,88 6.420.947,48 10,61% 10,92% Investments (Fair Value)
Aset Neto 5.170.158,74 5.818.325,71 6.431.528.10 12,54% 10,54% Net Assets
SPI (Posisi) 91.503,74 184.494,06 231.843,97 -101,62% 25,66% SPI (Position)
SPI (Delta) (33.612,97) 92.990,33 47.349,90 376,65% -49,08% SPI (Delta)
Pendapatan Investasi 382.252,71 452.010,86 494.400,05 18,25% 9,38% Investment Income
Beban Investasi 6.503,65 6.872,31 9.026,85 5,67% 31,35% Investment Expenses
Beban Operasional 13.713,22 20.016,90 24.074,91 45,97% 20,27% Operational Expenses
Penerimaan Iuran 497.538,70 554.549,54 596.782,23 11,46% 7,62% Contributions Received
Pembayaran Manfaat Pensiun 359.605,50 417.751,05 483.225,39 16,17% 15,67% Pension Benefits Paid
Hasil Usaha Bersih 353.806,60 418.378,15 455.044,79 18,25% 8,76% Net Business Result Including
Hasil Usaha Bersih + SPI (Delta) 320.193,63 511.368,48 502.394,69 59,71% -1,75% Net Business Result Including + SPI (Delta)
Cost Efisiensi Ratio 3,65% 4,50% 4,96% 23,21% 10,30% Cost Efficiency Ratio
ROI Dengan SPI 6,90% 9,60% 8,51% 39,18% -11,44% ROI with SPI
ROI Tanpa SPI 7,57% 7,94% 7,92% 4,94% -0,24% ROI without SPI
Pengaruh Faktor Internal & Asumsi Jumlah Peserta Influence of Internal Factors & Assumptions for Number of
Members
Perkembangan DPBM berkelanjutan merupakan landasan The continuous development of DPBM is the foundation for
penyusunan RKAPB tahun 2017. Pertumbuhan DPBM sejak 5 the preparation of the 2017 RKAPB. DPBM growth over the last
tahun terakhir yang meliputi pertumbuhan aset kelolaan, jumlah 5 years that includes the growth of assets under management,
peserta serta hasil pengembangan investasi sebagai berikut: the number of members and the result of investment
development are as follows:
Pertumbuhan Kinerja 2010-2016
Business Performance Growth 2010-2016
Uraian | Description 2016 2015 2014 2013 2012 2011 2010 CAGR
Data Peserta | Member Data
Jumlah Peserta (orang) 30.276 30.429 27.041 25.399 23.609 23.945 21.728 5,68%
Number of Members (People)
Penerimaan Iuran 558.047,92 497.538,70 435.868,59 378.728,50 340.269,00 300.125,00 263.563,00 13,32%
Contributions Received
Pembayaran Manfaat Pensiun 410.185,49 359.605,50 319.418,68 283.340,16 319.986,00 155.528,00 149.623,00 18,30%
Pension Benefits Oaid
Laporan Tahunan 2016 Annual Report | Dana Pensiun Bank Mandiri
211