
Page 86 - QEB_2_2016_lowres
P. 86
SOUTH AFRICA PERFORMANCE AND
OUTLOOK
Growth
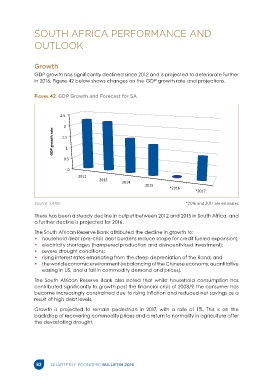
GDP growth has significantly declined since 2012 and is projected to deteriorate further
in 2016. Figure 42 below shows changes on the GDP growth rate and projections.
Figure 42 GDP Growth and Forecast for SA
2.5
2
GDP growth rate 1.5
1
0.5
0
2012
2013
2014
2015
*2016
*2017
Source: SARB *2016 and 2017 are estimates
There has been a steady decline in output between 2012 and 2015 in South Africa, and
a further decline is projected for 2016.
The South African Reserve Bank attributed the decline in growth to:
• household debt (pre-crisis debt burdens reduce scope for credit fueled expansion);
• electricity shortages (hampered production and disincentivised investment);
• severe drought conditions;
• rising interest rates emanating from the steep depreciation of the Rand; and
• the world economic environment (rebalancing of the Chinese economy, quantitative
easing in US, and a fall in commodity demand and prices).
The South African Reserve Bank also noted that whilst household consumption has
contributed significantly to growth post the financial crisis of 2008/9, the consumer has
become increasingly constrained due to rising inflation and reduced net savings as a
result of high debt levels.
Growth is projected to remain pedestrian in 2017, with a rate of 1%. This is on the
backdrop of recovering commodity prices and a return to normality in agriculture after
the devastating drought.
82 QUARTERLY ECONOMIC BULLETIN 2016