
Page 89 - QEB_2_2016_lowres
P. 89
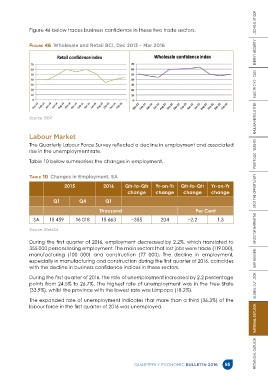
Figure 46 below traces business confidence in these two trade sectors.


              Figure 46  Wholesale and Retail BCI, Dec 2013 – Mar 2016


              Source: BER


              Labour Market
              The Quarterly Labour Force Survey reflected a decline in employment and associated
              rise in the unemployment rate.

              Table 10 below summarises the changes in employment.


              Table 10  Changes in Employment, SA

                              2015             2016      Qtr-to-Qtr   Yr-on-Yr   Qtr-to-Qtr    Yr-on-Yr
                                                          change      change      change       change              PROVINCIAL OUTLOOK      NATIONAL OUTLOOK      GLOBAL OUTLOOK      GAP HOUSING      INVESTOR NARRATIVE      SPOT THE OPPORTUNITY      PORTFOLIO INSIGHTS      KHULISA NEWSLETTER      ELECTRIC VEHICLES      ENERGY SECURITY      LOOKING AT GDP

                         Q1         Q4          Q1

                                             Thousand                                   Per Cent
                SA     15 459      16 018     15 663       –355         204          –2.2        1.3

              Source: StatsSA

              During the first quarter of 2016, employment decreased by 2.2%, which translated to
              355 000 persons losing employment. The main sectors that lost jobs were trade (119 000),
              manufacturing (100  000) and construction (77  000). The decline in employment,
              especially in manufacturing and construction during the first quarter of 2016, coincides
              with the decline in business confidence indices in these sectors.

              During the first quarter of 2016, the rate of unemployment increased by 2.2 percentage
              points from 24.5% to 26.7%. The highest rate of unemployment was in the Free State
              (33.9%), whilst the province with the lowest rate was Limpopo (18.2%).
              The expanded rate of unemployment indicates that more than a third (36.3%) of the
              labour force in the first quarter of 2016 was unemployed.


                                                             QUARTERLY ECONOMIC BULLETIN 2016        85