
Page 91 - QEB_2_2016_lowres
P. 91
3. About 20% of the WC’s exports to the UK are inputs into industry. Locally manufactured
exports used in the UK for the purpose of either maintenance or as inputs into the
production process, in short to medium term will not likely be affected. Inputs for the
purpose of new investments are likely to be impacted, and even then, the impact
will only relate to UK produced goods that are likely to be exported from the UK to
the EU. Much of the locally produced goods in the UK are locally consumed and not
exported to the EU.
Growth
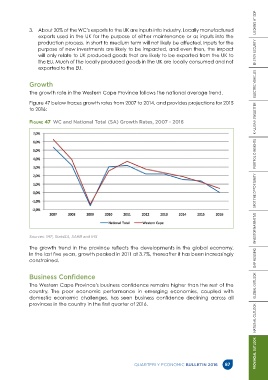
The growth rate in the Western Cape Province follows the national average trend.
Figure 47 below traces growth rates from 2007 to 2014, and provides projections for 2015
to 2016:
Figure 47 WC and National Total (SA) Growth Rates, 2007 - 2016
Sources: IMF, StatsSA, SARB and IHS PROVINCIAL OUTLOOK NATIONAL OUTLOOK GLOBAL OUTLOOK GAP HOUSING INVESTOR NARRATIVE SPOT THE OPPORTUNITY PORTFOLIO INSIGHTS KHULISA NEWSLETTER ELECTRIC VEHICLES ENERGY SECURITY LOOKING AT GDP
The growth trend in the province reflects the developments in the global economy.
In the last five years, growth peaked in 2011 at 3.7%, thereafter it has been increasingly
constrained.
Business Confidence
The Western Cape Province’s business confidence remains higher than the rest of the
country. The poor economic performance in emerging economies, coupled with
domestic economic challenges, has seen business confidence declining across all
provinces in the country in the first quarter of 2016.
QUARTERLY ECONOMIC BULLETIN 2016 87